
Figure 4.
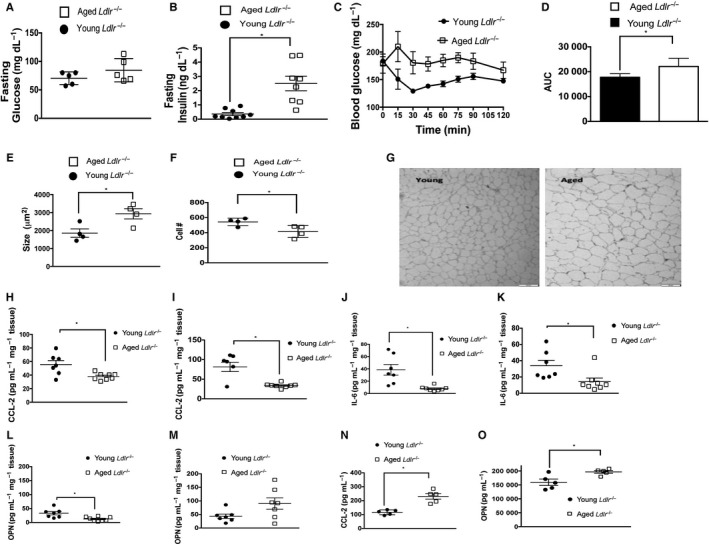
Aging leads to insulin resistance during atherogenesis. (A) Fasting blood glucose was obtained from young (2 months of age) and aged (12 months of age) Ldlr −/− mice administered a HFD for an additional 6 weeks. Glucose was measured via glucometer. *P < 0.01 (t‐test). (B) Fasting blood insulin was measured by ELISA obtained from young (2 months of age) and aged (12 months of age), Ldlr −/− mice administered a HFD for an additional 6 weeks. *P < 0.01 (t‐test). (C–D) Insulin tolerance test was performed in aged and young Ldlr −/− mice after a 4‐h fast. (D) Area under the curve (AUC) for D, P < 0.01 (Mann–Whitney), n = 5 mice/group. (E–F) Adipocytes were obtained from the epididymal (visceral) tissue of aged and young Ldlr −/− after 1‐month HFD. Cellularity and size were measured. P < 0.01 (t‐test). (G) Representative phase contrast micrographs show larger epididymal adipocytes in aged Ldlr −/− mice vs. young mice 1 month after HFD. 200× magnification. (H–M) Adipose tissue was obtained from the subcutaneous (H, J and L) and perigonadal (visceral) fat depots (I, K and M) from aged or young Ldlr −/− mice after 1 month of a HFD and cultured ex vivo. CCL‐2, IL‐6, and OPN measured in the culture supernatants via ELISA. *P < 0.05. (N–O) Plasma was obtained from young (2 months of age) and aged (12 months of age) Ldlr −/− mice after they were administered a HFD for 1 month. CCL‐2 (N) and OPN (O) were measured in the plasma by ELISA. P < 0.01 (t‐test).