Figure 4.

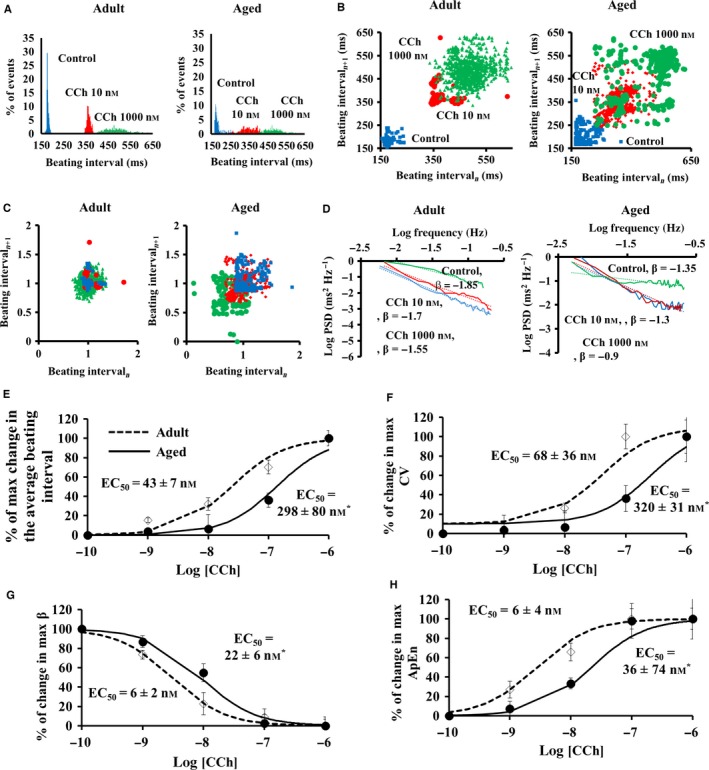
Beating interval dynamics in response to cholinergic receptor stimulation by carbachol (CCh) in the isolated SAN ex vivo. Representative examples of (A) distribution of beating intervals, (B) regular and (C) normalized Poincaré plots of the beating intervals, and (D) power‐law behavior (log power spectrum density—PSD vs. log frequency) of beating intervals response to CR stimulation by carbachol CCh in the isolated SAN ex vivo. Percent of maximal changes in (E) beating rate, (F) coefficient of variance (CV), (G) fractal scaling exponent (β), and (H) approximate entropy in response to different degrees of CR stimulation by carbachol (CCh) in the SAN tissue isolated from adult (n = 6) and aged (n = 6) mice.
