Figure 2.

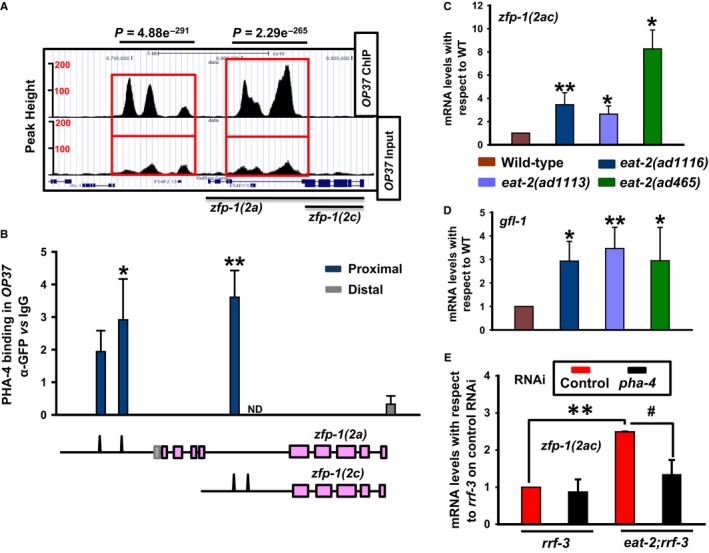
Dietary restriction (DR)‐specific transcription factor PHA‐4/FOXA also directly regulates zfp‐1 and gfl‐1. (A) UCSC browser view of PHA‐4/FOXA peaks on zfp‐1(2a) and zfp‐1(2c) promoters as determined by ChIP‐seq analysis of unc‐119(ed3) III; wgIs37 (OP37) strain; data mined from MODENCODE and reanalysed using our bioinformatic pipeline. Red boxes indicate the promoter regions of zfp‐1(2a) and zfp‐1(2c) where peaks are observed. Lower panel shows peaks in input samples. (B) ChIP‐PCR validation of PHA‐4/FOXA binding to zfp‐1 promoters obtained by ChIP‐seq analysis of OP37 strain. Enrichment using GFP antibody when normalized to that of IgG is plotted in the Y‐axis. The corresponding peaks on the promoters of zfp‐1, as obtained by ChIP‐seq (MODENCODE), are shown pictographically below the graph. ND – not determined. (C,D) Quantitative RT (QRT)–PCR analysis of the transcript levels of zfp‐1(2ac) (C) or gfl‐1 (D) in different eat‐2 mutant strains. The graph is plotted from three or more experiments. (E) QRT–PCR detection of transcript levels for zfp‐1(2ac) in rrf‐3(pk1426) or eat‐2(ad1116);rrf‐3(pk1426) grown on control or pha‐4 RNAi. Error bars are standard deviation. **P ≤ 0.01;*P ≤ 0.05; # P ≤ 0.05 by Student's t‐test.
