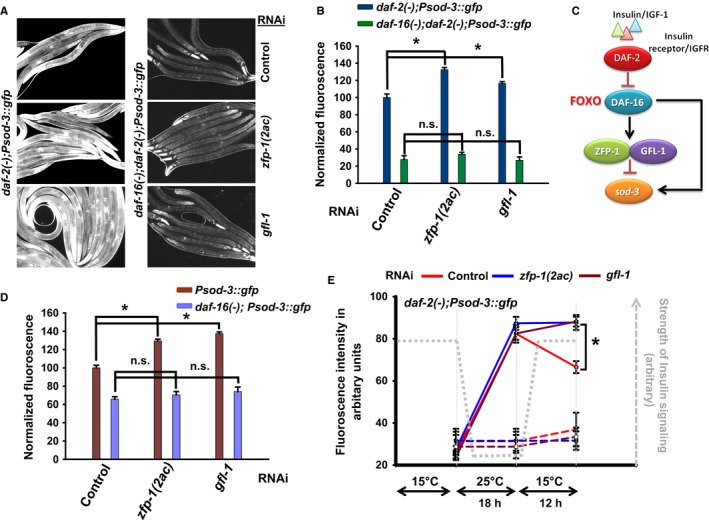
Figure 3.

ZFP‐1 and GFL‐1 negatively regulate sod‐3, a positively regulated DAF‐16/FOXO direct target, forming a type 1 incoherent feed‐forward loop. (A) daf‐2(‐);Psod‐3::gfp or daf‐16(‐);daf‐2(‐);Psod‐3::gfp was grown on control, zfp‐1(2ac) or gfl‐1 RNAi and images captured under fluorescence microscope at 100× magnification. (B) Quantification of GFP fluorescence as observed in (A) using ImageJ. Fluorescence was normalized to daf‐2(‐);Psod‐3::gfp on control RNAi. The error bars indicate SEM between two or more experiments. (C) A circuit diagram showing a type I incoherent feed‐forward loop involving ZFP‐1, DAF‐16/FOXO and sod‐3. (D) Quantification of GFP fluorescence in Psod‐3::gfp or daf‐16(‐);Psod‐3::gfp on control, zfp‐1(2ac) or gfl‐1 RNAi. Fluorescence was normalized to Psod‐3::gfp on control RNAi. The error bars indicate SEM between three experiments. (E) daf‐2(‐);Psod‐3::gfp worms were grown at 15 °C on control, zfp‐1(2ac) or gfl‐1 RNAi since hatching. L3 worms were shifted to 25 °C for 18 h and then shifted back to 15 °C. At the mentioned time points, images were acquired using a fluorescence microscope and quantified using ImageJ. Data shown are from one of two experiments. Dotted lines represent the worms maintained at 15 °C throughout on respective RNAi. The error bars indicate standard error mean for n > 25. *P ≤ 0.05 by Student's t‐test, n.s., non‐significant.
