
Figure 1.
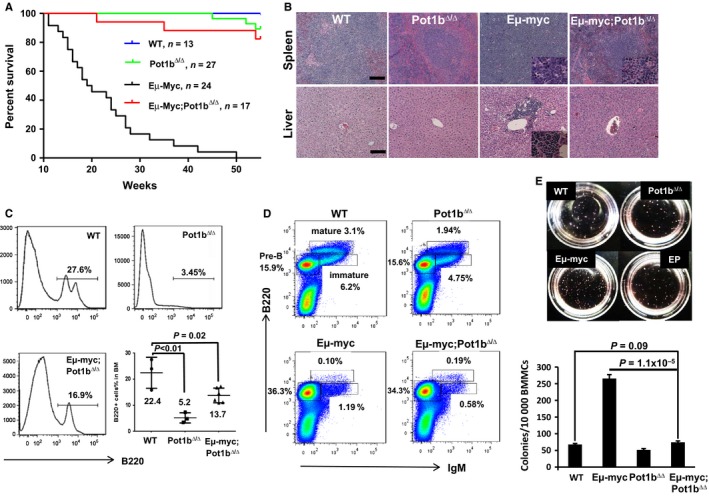
Inhibition of tumorigenesis in Eμ‐myc; Pot1b Δ/Δ mice promotes lifespan extension. (A) Kaplan–Meier analysis of tumor free survival of WT, Pot1b Δ/Δ, Eμ‐myc and Eμ‐myc; Pot1b Δ/Δ mice. All mouse cohorts were monitored for at least 55 weeks and sacrificed when moribund. A significant increase in lifespan of Eμ‐myc; Pot1b Δ/Δ over Eμ‐myc mice was observed (P < 0.0001). The log‐rank test was used to calculate statistical significance. (B) Hematoxylin and eosin (H&E) staining of tissues from Eμ‐myc mice demonstrates malignant B‐cell infiltration of the spleen and metastasis to the liver. Mice of other genotypes show normal spleen and liver architectures (magnification × 10). Scale bar: 25 μm. Insets show magnified (40 ×) malignant cells. (C) First three panels: representative FACS analysis of B220 positive cells in whole bone marrow (WBM) of 55 weeks old mice of the indicated genotypes. Significantly reduced number of B220+ cells were found in the Eμ‐myc Pot1b Δ/Δ mice compared with those of WT (P = 0.02). Last panel: summary of results. A two‐tailed Student's t test was used to calculate statistical significance. WT: n = 3. Pot1bΔ/Δ: n = 4. Eμ‐myc Pot1bΔ/Δ: n = 6. (D) Representative FACS analysis of pre‐B (B220+, IgM−), immature B (B220 lower, IgM+) and mature B cells (B220 higher, IgM+) in WBM from mice of the indicated genotypes. A summary of the data is shown in Table 1. Each experiment was repeated at least three times. (E) (Top) Representative images of colony forming assays after 12 days in culture in M3630 media specific for pre‐B cells growth. Cell genotypes are indicated. EP: Eμ‐myc; Pot1b Δ/Δ. (Bottom) Quantification of the number of colonies. No significant differences exist between WT and Eμ‐myc; Pot1b Δ/Δ cells (P = 0.09). There is a significant difference between Eμ‐myc and Eμ‐myc; Pot1b Δ/Δ cells (P = 1.1 × 10⁻⁵). Results are mean from three experiments, and error bars represent SEM. A two‐tailed Student's t test was used to calculate statistical significance.