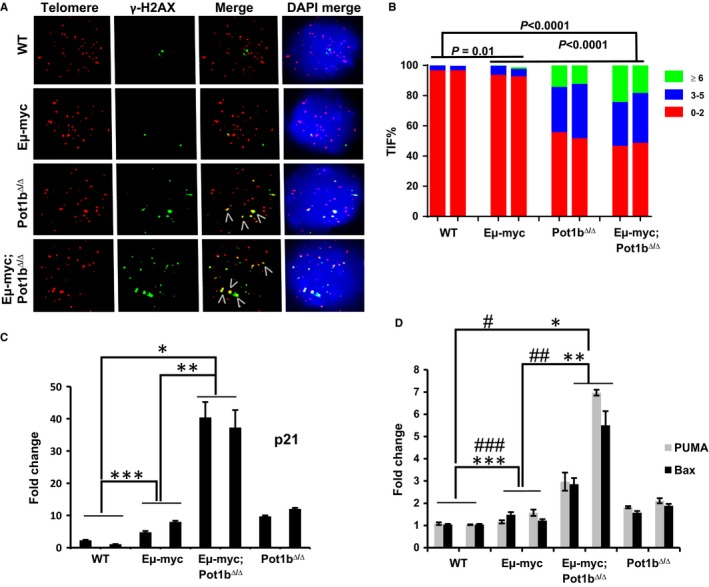
Figure 2.

Enhanced DNA damage response in Eμ‐myc; Pot1b Δ/Δ B220+ cells. (A) Representative TIF images of B‐ cells from mice of the indicated genotypes. Cells were stained with anti‐ γ‐H2AX antibody (green), telomere PNA‐FISH probe [Tam‐OO‐(CCCTAA)4 (red)] and DAPI (blue). B‐cells were harvested from at least three 6–8 weeks old mice per genotype. (B) Quantification of percentage sorted B220+ cells displaying γ‐H2AX‐positive TIFs. A minimum of 150 nuclei were scored per genotype. A higher frequency of TIFs was detected in Eμ‐myc; Pot1b Δ/Δ B220+ cells compared with Eμ‐myc cells (P < 0.001). 2‐way ANOVA was performed to calculate statistical significance. (C) and (D) Real‐time PCR quantification of mRNA expression levels of p21 (C), PUMA and Bax (D) in sorted B220+ cells from 6 to 8 weeks old mice of the indicated genotypes. Each experiment was repeated in triplicate. Error bars represent SEM. 2‐way ANOVA was performed to calculate statistical significance. For (C), *P = 4.7 × 10⁻⁸, **P = 2.4 × 10⁻⁷ and ***P = 1.5 × 10⁻⁴. For (D), PUMA: # P = 1.5 × 10⁻⁴; ## P = 2.7 × 10⁻³; ### P = 1.4 × 10⁻². BAX: *P = 6.7 × 10⁻⁴; **P = 1.4 × 10⁻³; ***P = 2.8 × 10⁻³.
