Figure 3.

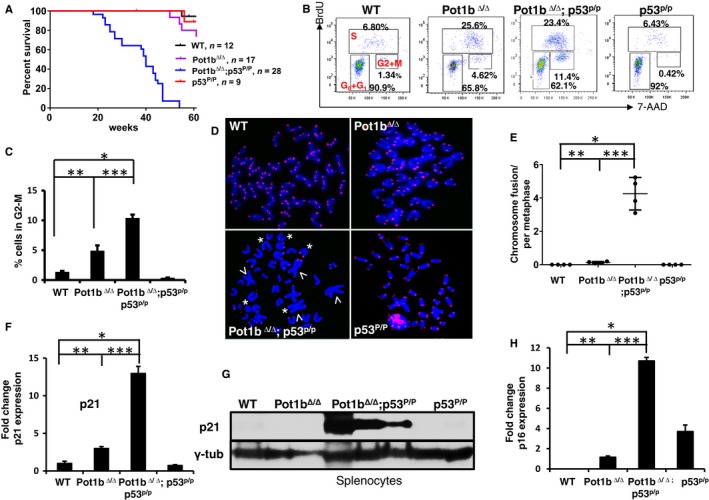
Deletion of Pot1b promotes cell cycle arrest and limits cellular proliferation. (A) Kaplan–Meier survival analysis of mice of the indicated genotypes. All mice were monitored for 60 weeks and sacrificed when moribund. A log‐rank test was used to calculate statistical significance. The lifespan of Pot1b Δ/Δ ; p53 P/P mice was significantly shorter than that of p53 P/P mice (P < 0.0001). (B) BrdU cell‐cycle analysis of LSK cells isolated from 30 to 35 weeks old mice of the indicated genotypes. Representative FACS plots from experiments with at least three mice in each genotype are shown. Percentage of cells in various phases of the cell cycle are indicated. For example, Pot1b Δ/Δ ; p53 P/P mice have 11.4% BM LSK cells in the G2/M phase of the cell cycle. (C) Quantification of cells in (B) undergoing G2/M cell cycle arrest. A two‐tailed student's t test was used to calculate statistical significance. P values: *P = 1.08 × 10⁻⁵; **P = 2.4 × 10⁻³; ***P = 8.1 × 10⁻⁴. (D) Telomere PNA‐FISH of metaphase spreads showing end‐to‐end chromosome fusions (arrowheads) and telomere signal‐free ends (SFEs) (*). Only representative SFEs are indicated. At least four mice were used for each genotype, and a minimum of 40 metaphases scored per genotype. (E) Quantification of chromosome fusions in (D). A two‐tailed student's t test was used to calculate statistical significance. P values: *P = 2.0 × 10⁻⁴; **P = 1.6 × 10⁻²; ***P = 1.0 × 10⁻⁴. (F) Real‐time RT‐PCR analysis of p21 expression levels in sorted LSK cells from 30 to 35 weeks old indicated mice. Each experiment was repeated in triplicate. Error bars represent SEM. A two‐tailed student's t test was used to calculate statistical significance. *P = 4.5 × 10⁻⁵; **P = 4.8 × 10⁻⁴; ***P = 2.4 × 10⁻⁵. (G) Western blot for p21expression in splenocytes from mice of indicated genotypes. γ‐tubulin was used as the loading control. (H) Real‐time RT‐PCR analysis of p16 expression levels in sorted LSK cells from 30 to 35 weeks old indicated mice. Each experiment was repeated in triplicate. Error bars represent SEM. A two‐tailed student's t test was used to calculate statistical significance. *P = 1.6 × 10⁻⁸; **P = 1.1 × 10⁻⁴; ***P = 7.9 × 10⁻⁷.
