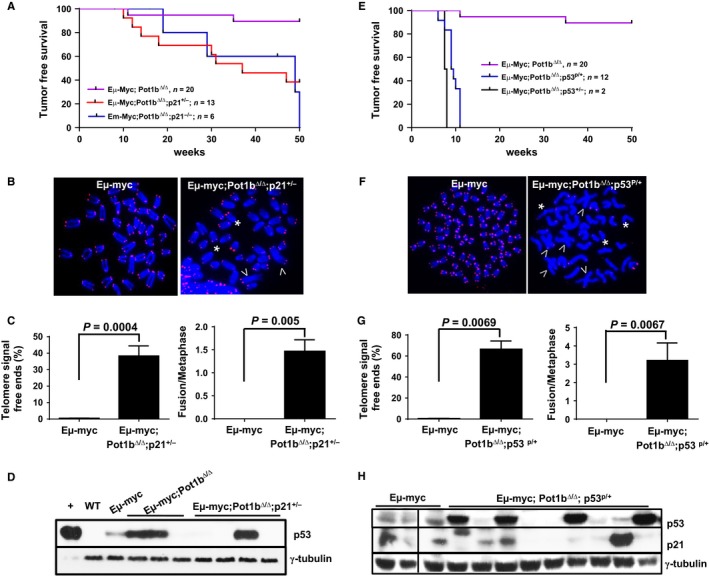
Figure 4.

Both p53 dependent apoptosis and cellular senescence are required for complete tumor suppression in Eμ‐myc; Pot1b Δ/Δ mice. (A) Kaplan–Meier survival analysis of mice of the indicated genotypes, monitored over 50 weeks and sacrificed when moribund. Compared to the lifespan of Eμ‐myc; Pot1b Δ/Δ mice, the lifespan of Eμ‐myc; Pot1b Δ/Δ ; p21 +/− and Eμ‐myc; Pot1b Δ/Δ ; p21 −/− mice were significantly reduced (both P values < 0.01). The survival between Eμ‐myc; Pot1b Δ/Δ ; p21 +/− and Eμ‐myc; Pot1b Δ/Δ ; p21 −/− mice was not significantly different (P = 0.08). (B) Telomere FISH analysis of metaphase chromosome spreads from Eμ‐myc and Eμ‐myc; Pot1b Δ/Δ ; p21 +/− lymphomas using Tam‐OO‐(CCCTAA)4 (red) and DAPI (blue). A minimum of 50 metaphases were analyzed per genotype. Arrows indicate fused chromosomes; *indicates signal free chromosome ends. Only a few SFEs are shown. (C) Quantification of percentage of telomere SFEs (left) and chromosome fusions (right) in tumor metaphases shown in (B). Metaphases from lymphomas isolated from at least three different mice were examined. A two‐tailed Student's t test was used to calculate statistical significance. (D) Western blot for p53 expression in tumors isolated from mice of the indicated genotype. +: aphidocolin treated WT MEF cells, loaded at 20% the level of other samples. WT: normal splenocytes. γ‐tubulin was used as loading control. (E) Kaplan–Meier survival analysis of mice of the indicated genotypes, monitored over 50 weeks and sacrificed when moribund. The difference in survival between the Eμ‐myc; Pot1b Δ/Δ ; Trp53 P/+ mice and Eμ‐myc; Pot1b Δ/Δ mice was highly significant (P < 0.001). (F) Telomere FISH analysis of metaphase chromosome spreads of Eμ‐myc and Eμ‐myc; Pot1b Δ/Δ ; Trp53 P/+ lymphomas using Tam‐OO‐(CCCTAA)4 PNA (red) and DAPI (blue). A minimum of 50 metaphases were analyzed per genotype. Arrowheads indicate fused chromosomes; *indicate telomere SFEs. (G) (left) Quantification of percentage of telomere SFEs (left) and chromosome fusions (right) in tumor metaphases shown in (F). Metaphases from lymphomas isolated from at least three different mice were examined. A two‐tailed Student's t test was used to calculate statistical significance. (H) Western blot for p53 and p21 expression in tumors isolated from mice of the indicated genotypes. γ‐tubulin was used as loading control.
