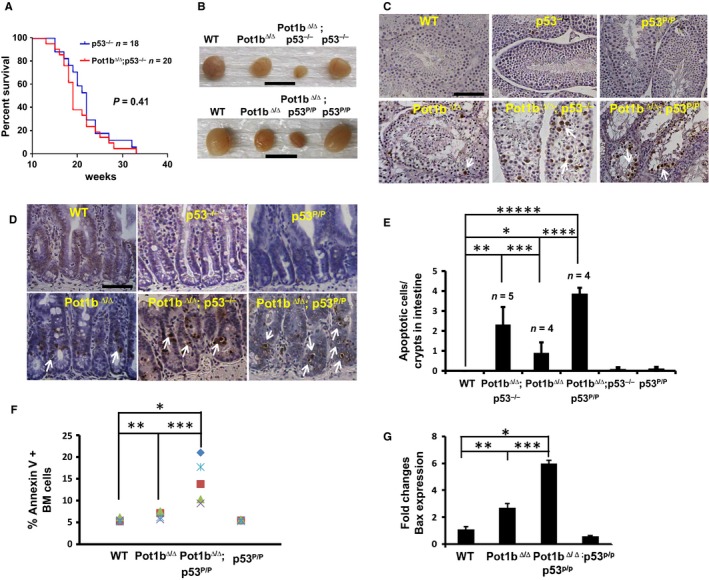
Figure 5.

Loss of functional p53 accelerates proliferative defects in Pot1b Δ/Δ ; p53 −/− mice. (A) Kaplan–Meier survival analysis showing the percent survival of p53 −/− and Pot1b Δ/Δ ; p53 −/− mice. All mice were monitored for 40 weeks and sacrificed when moribund. The log‐rank test was used to calculate statistical significance. No significant survival difference was observed between the two cohorts (P = 0.41). (B) Testes from mice of the indicated genotypes. Scale bar: 10 mm. (C) TUNEL staining of testicular sections from mice of indicated genotypes. Magnification: 20×, scale bar: 50 μm. Representative TUNEL positive cells are indicated by arrowheads. (D) Representative TUNEL stained intestinal sections from mice of the indicated genotypes. Arrowheads indicate apoptotic cells. Scale bar: 25 μm. (E) Quantification of apoptotic cells in basal crypts of intestines from (D). A two‐tailed student's t test was used to calculate statistical significance. *P = 4.2 × 10⁻²; **P = 4.4 × 10⁻³; ***P = 4.6 × 10⁻²; ****P = 4.9 × 10⁻⁴; *****P = 4.6 × 10⁻⁶. (F) Annexin V staining of bone marrow cells isolated from indicated mouse cohorts at 30–35 weeks of age. BMs from a minimum of five mice per genotype were analyzed. A two‐tailed student's t test was used to calculate statistical significance. *P = 2.1 × 10⁻⁴; **P = 4.0 × 10⁻³; ***P = 9.0 × 10⁻³. (G) Real‐time RT‐PCR quantification of mRNA expression levels of Bax in sorted LSK cells from 30 to 35 weeks old mice of indicated genotypes. Each experiment was repeated in triplicate. Error bars represent SEM. A two‐tailed student's t test was used to calculate statistical significance. *P = 1.21 × 10⁻⁵; **P = 1.8 × 10⁻³; ***P = 1.0 × 10⁻⁴.
