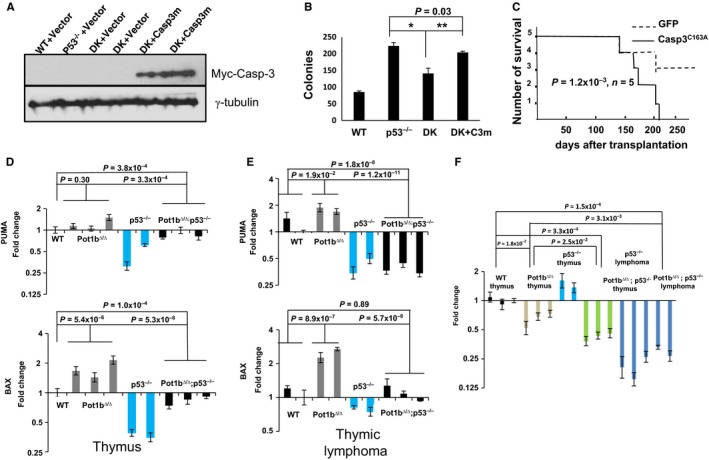
Figure 7.

Activation of p53‐independent apoptosis represses B‐cell, but not T‐cell lymphomagenesis. (A) Immunoblotting for Myc‐Caspase‐3C163A expression in FACS sorted GFP+ fetal liver cells of the indicated genotypes. Vector: MSCV‐IRES‐GFP empty vector. Casp3m: MSCV‐Myc‐Caspase‐3C163A‐IRES‐GFP. DK: Pot1b Δ/Δ ; p53 −/− double knockout cells. γ‐tubulin was used as the loading control. (B) Quantification of in vitro colony forming assays for sorted GFP+ fetal liver cells in B‐cell specific M3630 medium. Results are mean from three independent experiments. Error bars represent SEM. A two‐tailed student's t test was used to calculate statistical significance*P = 2.1 × 10⁻³; **P = 3.1 × 10⁻³. (C) Kaplan–Meier survival analysis showing the percent survival of SCID mice transplanted with either Pot1b Δ/Δ ; p53 −/− fetal liver cells expressing empty vector or MSCV‐Myc‐Caspase‐3C163A‐IRES‐GFP. (D–G) Real‐time RTPCR analysis of PUMA and BAX expression profiles in thymus (D) and thymic lymphomas (E) from 6 weeks old mice of the indicated genotypes. Each experiment was repeated in triplicate. Error bars represent SEM. A 2‐way ANOVA analysis was performed to calculate statistical significance. (F) Real‐time RT‐PCR analysis of p73 expression profiles in 6 weeks thymus and thymic lymphomas of the indicated genotypes. Each experiment was repeated in triplicate. Error bars represent SEM. A 2‐way ANOVA analysis was performed to calculate statistical significance.
