Figure 2.

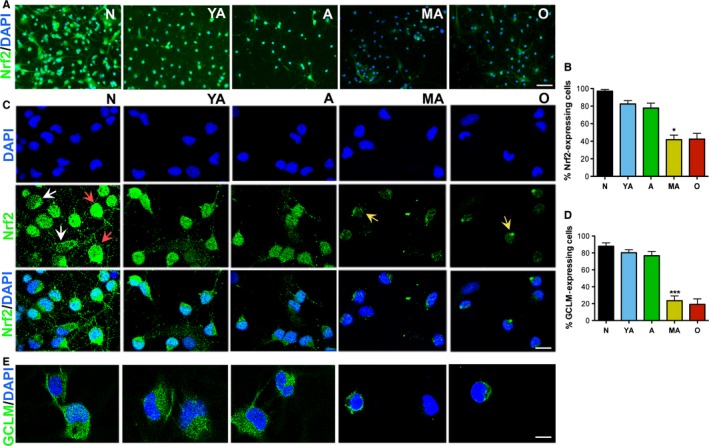
Cultured NSPCs show reduced Nrf2 expression/activity with advancing age. Low magnification images of Nrf2 expression across age are shown in (A), with quantification in (B) (P < 0.05, A vs. MA,). High magnification confocal images of Nrf2 expression are shown in (C) [Nrf2 expression in the cytoplasm (white arrows), and/or nucleus (red arrows) in younger cells, low or no Nrf2 expression in MA and O cells (yellow arrows)]. Analysis of expression of the Nrf2 target gene, GCLM, is in E and D (P < 0.01, A vs. MA). [*P < 0.05, ***P < 0.001, one‐way ANOVA, post hoc Tukey's test]. Scale Bar: A, 50 μm; C, 15 μm; E, 10 μm.
