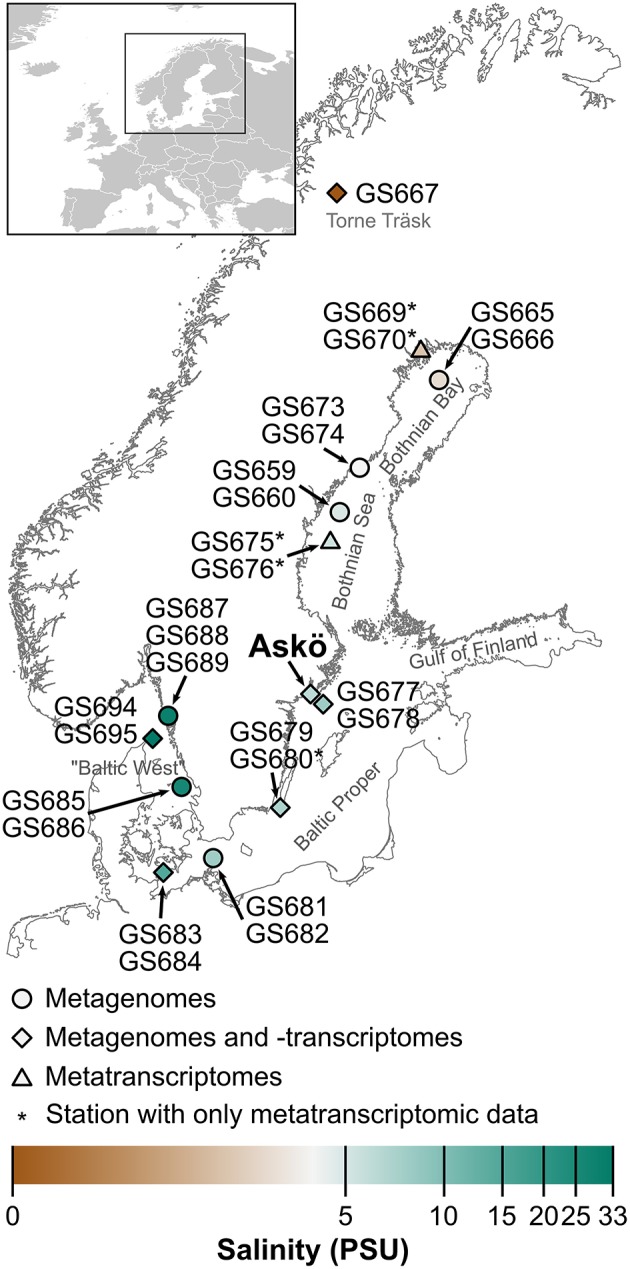
Figure 1.

Map of the Baltic Sea area specifying the locations of the sampling stations (GS) in the 2009 Global Ocean Sampling Baltic Sea transect (Phase I), and the time series of 2011 (Phase II) and 2012 (Phase III) off the coastal station Askö (south of Stockholm). The samples taken at the different stations were used for generating metagenomes, metatranscriptomes, or both, as indicated by the shape of the map marker symbols. The color of the markers show the salinity gradient inherent to this system.
