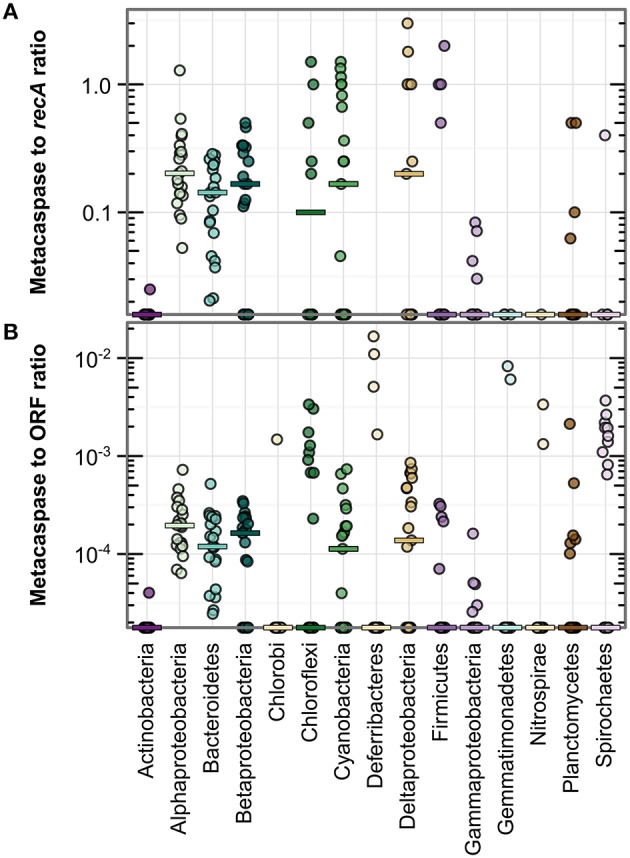
Figure 3.

Metacaspase gene abundance within bacterial groups along the Baltic Sea transect (Phase I; 21 stations). Abundance is given as the ratio of bacterial metacaspase to recA sequences (A) or the ratio of bacterial metacaspase sequences to all bacterial ORFs (B). Values are presented on a log-10 scale, with zeros at the bottom of each panel. The horizontal bars indicate medians. Significant differences are given in Table S3. Note the absence of data points for Chlorobi and Deferribacteres in (A) due to the lack of detection of recA sequences in these groups.
