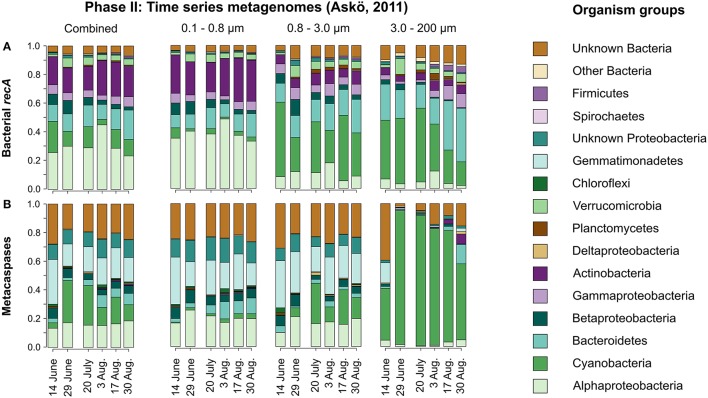
Figure 5.
Taxonomic distribution of bacterial recA (A) and metacaspase genes (B) in metagenomes derived from the time series of the summer season 2011 at Askö (Phase II; 6 time points, June–August). The relative values are summed average nucleotide coverages for the assembled contigs to which the identified genes belong. The data are presented for each of the non-viral size fractions individually as well as combined by date.

