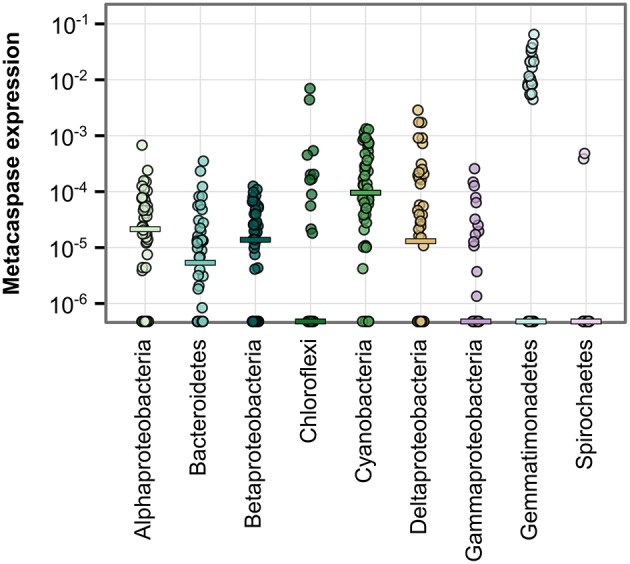
Figure 6.

Metacaspase gene expression level by bacterial group. Each point represents one metatranscriptomic sample (Phase I and III; 50 samples). Expression levels are given as the number of reads mapping to bacterial metacaspase transcripts divided by the total number of reads mapping to bacterial transcripts. Values are presented on a log-10 scale, with zeros at the bottom of each panel. Horizontal bars indicate medians. Significant differences are described in Table S3.
