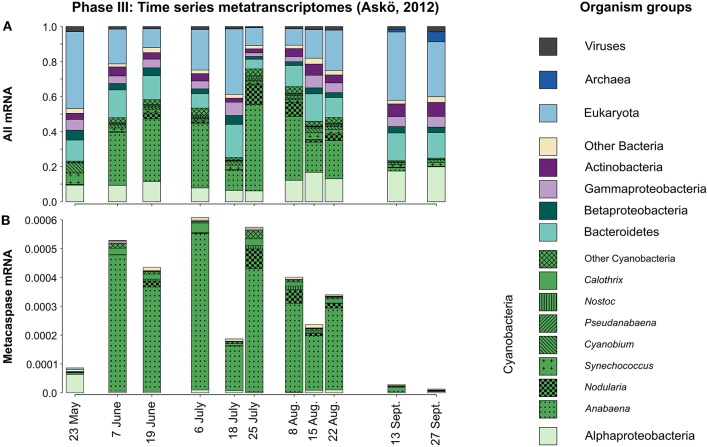
Figure 7.
Taxonomic distribution of all microbial groups (A) and their expressed metacaspase genes (B) in the metatranscriptomes sampled during the 2012 Askö time series (Phase III; 11 samples, May–September). The displayed values are based on mapped read counts. For metacaspase genes the read counts were divided by the grand total number of mapped reads, thus showing the expression of these genes relative to the whole community transcription (B). Note that Cyanobacteria are presented at the genus level.

