
Figure 8.
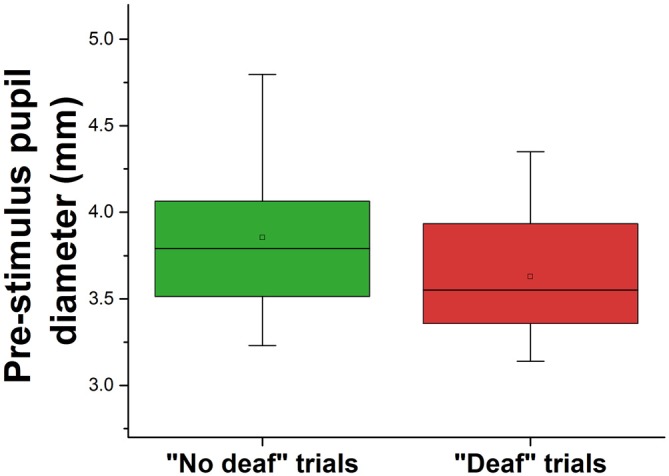
Pre-stimulus pupil diameter (fixation n—1) for hit and missed auditory stimuli. The square in the center of the boxes represent the mean, the horizontal line in the center of the boxes represent the 50th percentile (median), the end of the boxes represent the 25th and 75th percentiles, and the whiskers represent the 5th and 95th percentiles.