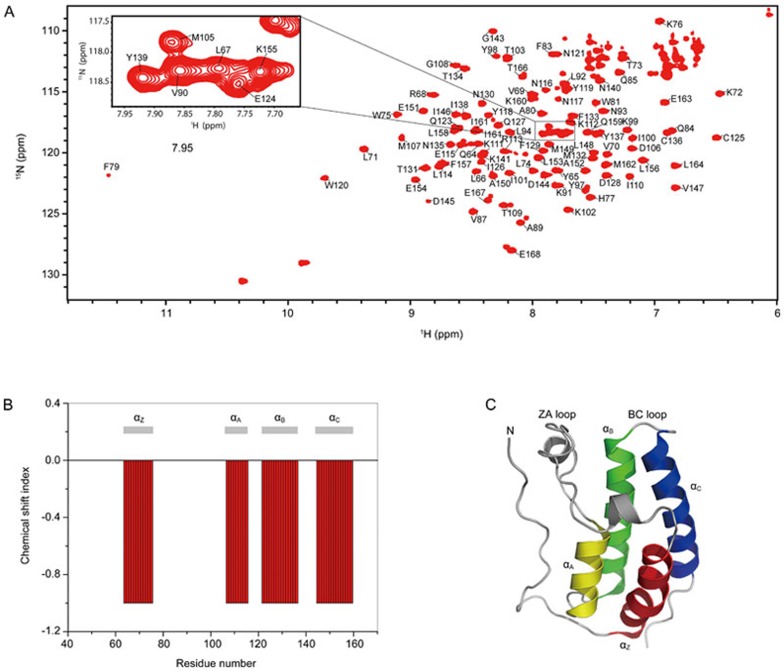
Figure 3.
NMR-based characterization of the solution structure of BRD4(I). (A) [1H, 15N] HSQC spectrum of BRD4(I). Backbone amide resonance assignments are labeled with the one-letter amino acid code and the sequence number. The insert shows an expanded view of a region with cross-peaks partially overlapped. (B) Consensus chemical shift index (Cα) for BRD4(I). The predicted secondary structural elements are shown together with the CSI plot. (C) Ribbon representation of the crystal structure of BRD4(I) (PDB code: 2OSS).

