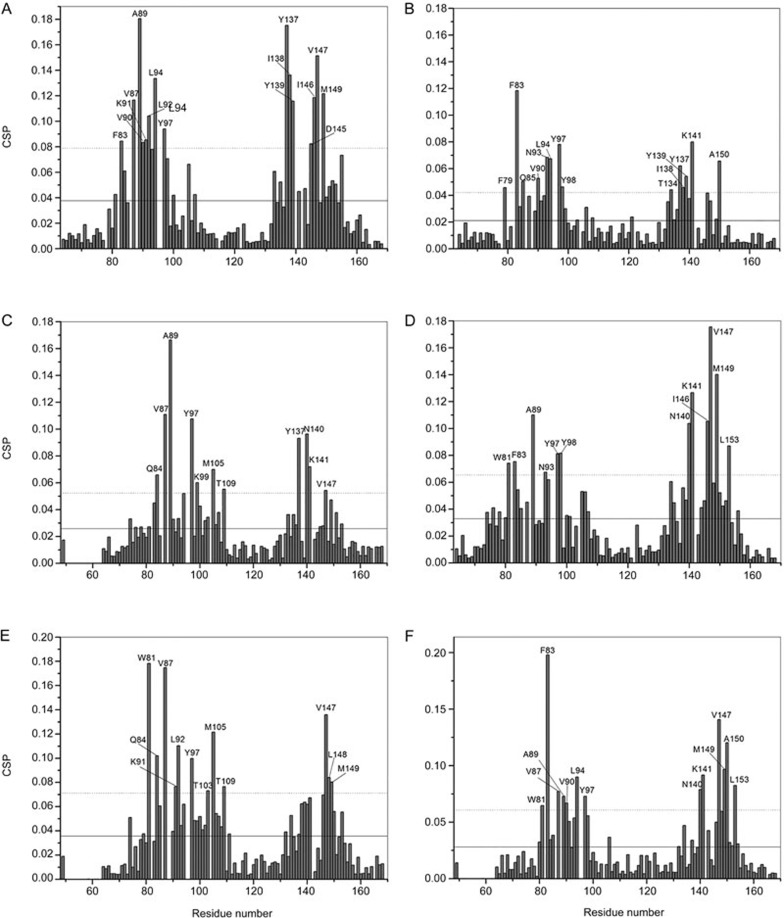
Figure 4.
Chemical shift perturbation (CSP) analysis for BRD4(I) upon hit compound binding. Solid and dashed lines indicate the mean and mean±SD values, respectively. Residues with CSP values above the dashed line are labeled. (A) CSP analysis for BRD4(I) after binding of hit compound 1. (B) CSP analysis for BRD4(I) after binding of hit compound 6. (C) CSP analysis for BRD4(I) after binding of hit compound 7. (D) CSP analysis for BRD4(I) after binding of hit compound 8. (E) CSP analysis for BRD4(I) after binding of hit compound 9. (F) CSP analysis for BRD4(I) after binding of hit compound 10.

