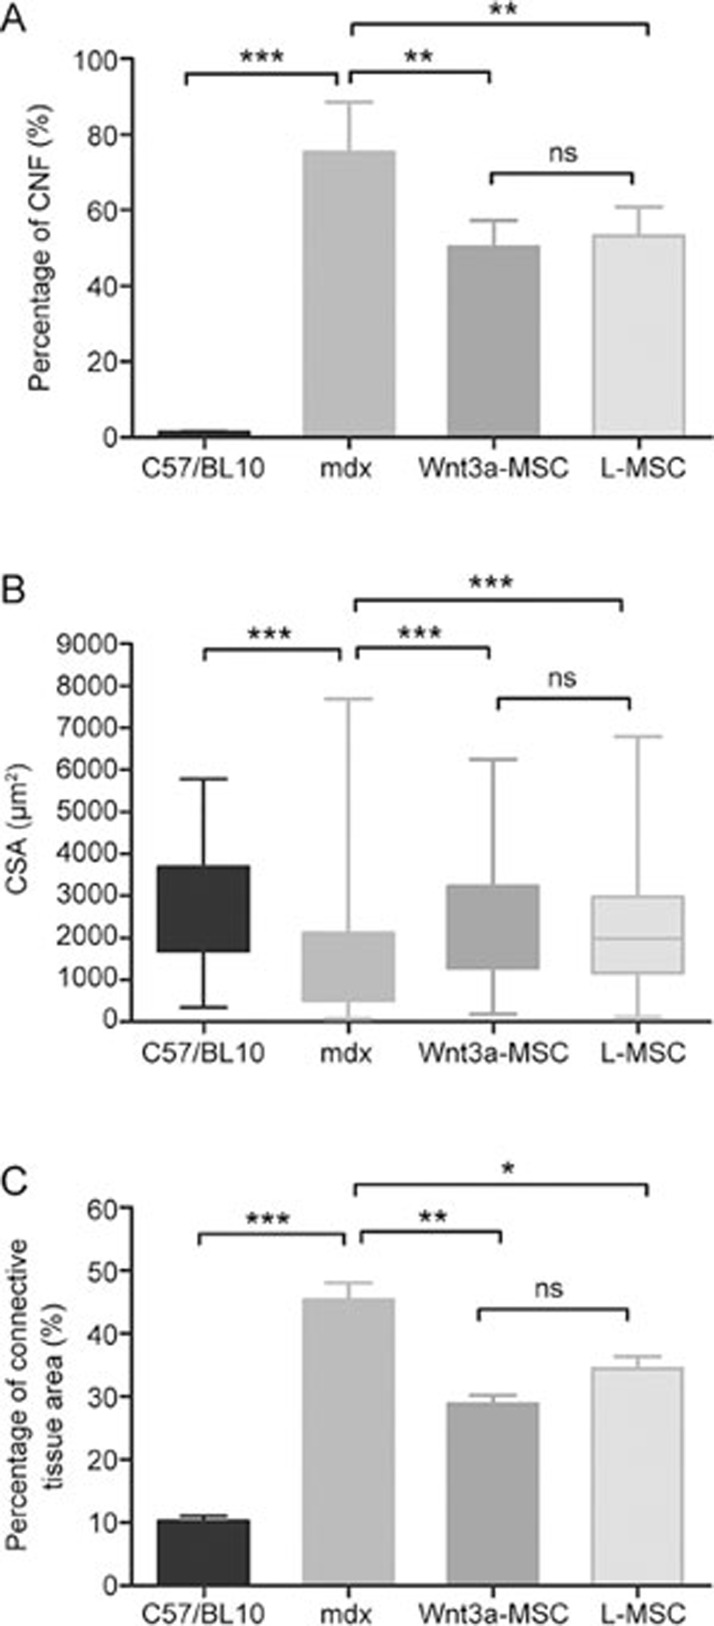
Figure 2.
Quantification of central nucleation (CNF), cross-sectional area (CSA), adipose, and connective tissue area on H&E stained sections of gastrocnemius muscle from C57/BL10, mdx, Wnt3a-MSC and L-MSC transplantation mice after 16 weeks transplantation. Six mice were analyzed in each group; at least 1000 myofibers per section were counted. All values were expressed as the mean±SD. Significance between the groups was assessed using one-way ANOVA followed by Bonferroni post test. nsP>0.05; *P<0.05; **P<0.01.

