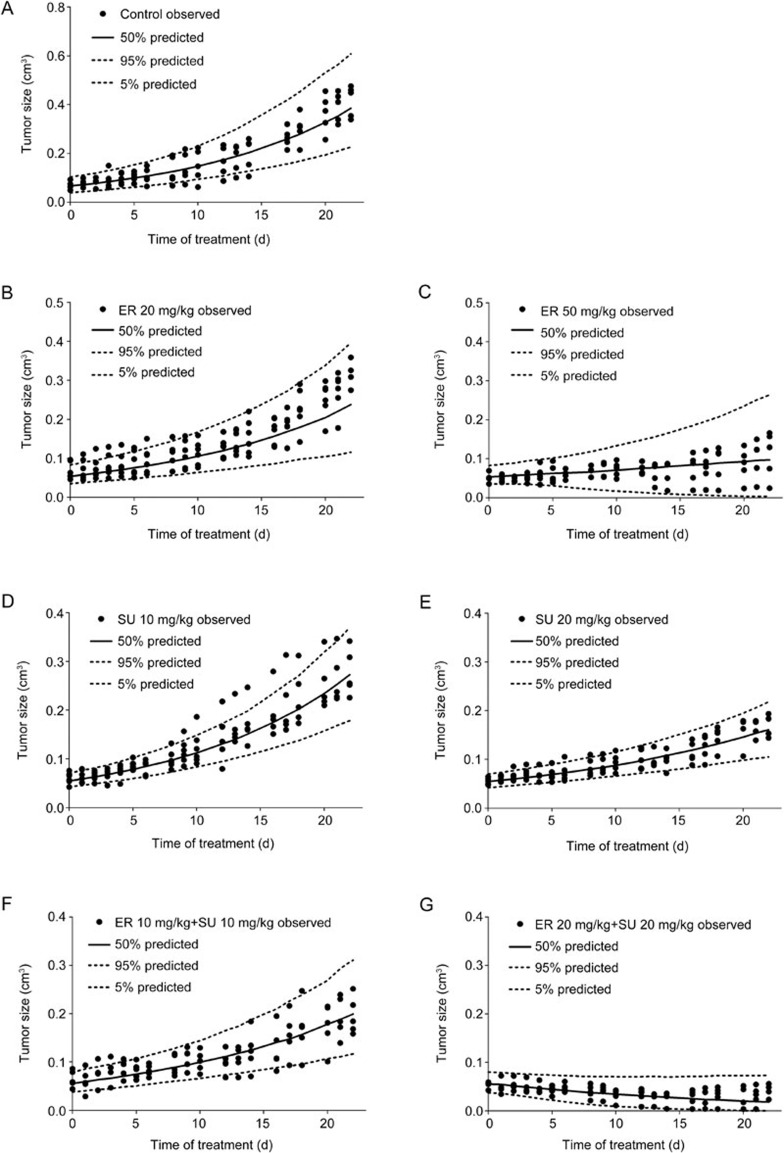
Figure 5.
The VPC results of the PK/PD models in BALB/c nude mice bearing an A549 xenograft using a simulation that was conducted 1000 times. (A) Control group, (B) 20 mg/kg ER, (C) 50 mg/kg ER, (D) 10 mg/kg SU, (E) 20 mg/kg SU, (F) 10 mg/kg ER and 10 mg/kg SU, and (G) 20 mg/kg ER and 20 mg/kg SU. The range between the dashed lines represents the 90% confidence intervals, the solid lines are the medians of the simulated data, and the solid dots are the observed data.

