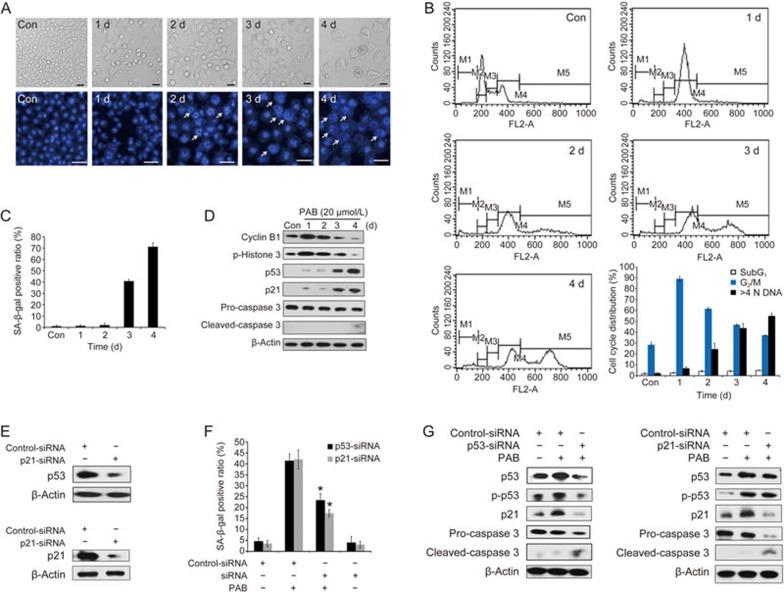
Figure 5.
PAB-induced mitotic catastrophe is followed by senescence in H460 cells. (A–D) The cells were incubated with 20 μmol/L PAB for the indicated time periods between d 0 and d 4. (A) The cells were observed with a phase contrast microscope (×100 magnification, upper panels), and changes in the nuclear morphology were detected by DAPI staining (×200 magnification, lower panels). The white arrows indicate multinucleated cells. (B) The percent of cells in various phases of the cell cycle was calculated by flow cytometry. (C) The senescent cells were examined by SA-β-Gal staining. The ratio of the SA-β-Gal positive cells is shown. (D) The protein levels of cyclin B1, p-Histone 3 (Ser10), p53, p21 and caspase-3 were evaluated by a Western blot. (E–G) H460 cells were transfected with control, p53 or p21 siRNA for 24 h. (E) A Western blot analysis was utilized to detect the transfection efficiency. (F) The senescent cells were determined by using SA-β-Gal staining. The ratio of the SA-β-Gal positive cells is shown. (G) Western blot was applied to examine the expression of p53, p-p53 (Ser 15), p21 and caspase-3. The data are presented as the mean±SD of three independent experiments. *P<0.05 vs PAB-treated group.

