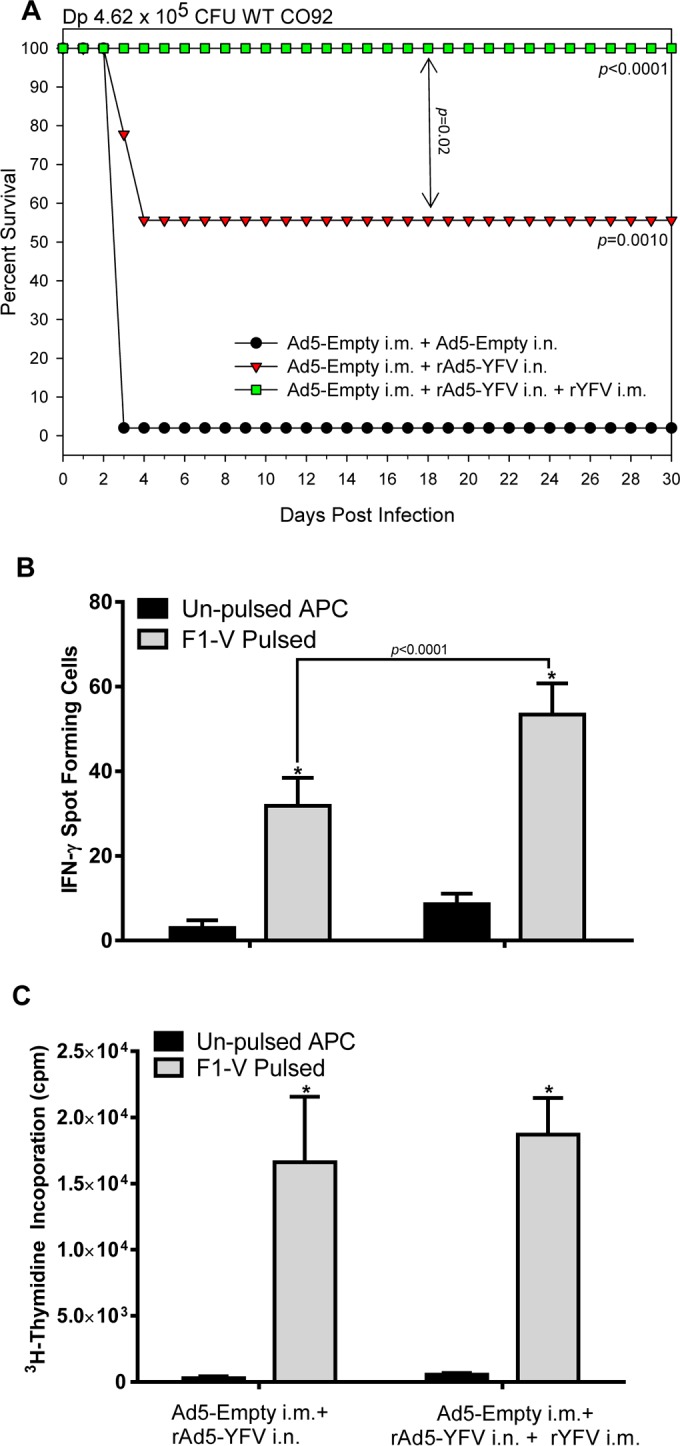
FIG 4.

T-cell mediated immune response in mice elicited by immunization with the rAd5-YFV vaccine alone or in combination with rYFV. PreAd mice (n = 10 to 25) were either i.n. immunized with 8 × 10⁹ v.p./40 μl of rAd5-YFV alone or in combination with 10 μg of rYFV (emulsified 1:1 in alum adjuvant) i.m. The immunizations occurred 2 weeks apart. (A) After 15 days postimmunization, 20 mice from each immunized group and 10 from the control group were aerosol challenged with WT CO92 at a Dp of 4.62 ×10⁵ CFU. The P values are in comparison to the negative-control group or between groups (as indicated by the arrow) and are based on Kaplan-Meier curve analysis. (B) On day 15 after the last immunization, T cells were isolated separately from the spleens of the remaining unchallenged 5 mice in each immunized group. The isolated T cells were cocultured with gamma-irradiated APCs pulsed or not with F1-V fusion protein (100 μg/ml). The IFN-γ-producing T cells were measured after 2 days of incubation with the APCs by using the enzyme-linked immunosorbent spot (ELISpot) assay. (C) T-cell proliferation was assessed by measuring incorporation of [3H]thymidine on day 3 of coculture with the APCs. The arithmetic means ± standard deviations were plotted. Data were analyzed by using two-way ANOVA with Tukey's post hoc correction. The statistical significance is indicated by asterisks in comparison of the pulsed and unpulsed T cells within each group or displayed by a horizontal line with the P value.
