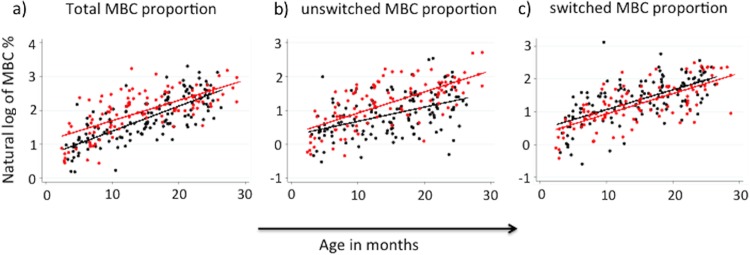
FIG 1.
Distribution of memory B cells (CD19+ CD10− CD27+) (a), unswitched memory B cells (CD19+ CD10− CD27+ IgM+) (b), and switched memory B cells (CD19+ CD10− CD27+ IgM−) (c) in HUU infants (red dots) and HEU infants (black dots). Straight lines show the best-fit prediction of the increment in subset proportions over the 2 years of life. The percentage of memory B cell subsets is presented on the y axis as the natural log of the MBC percentages.

