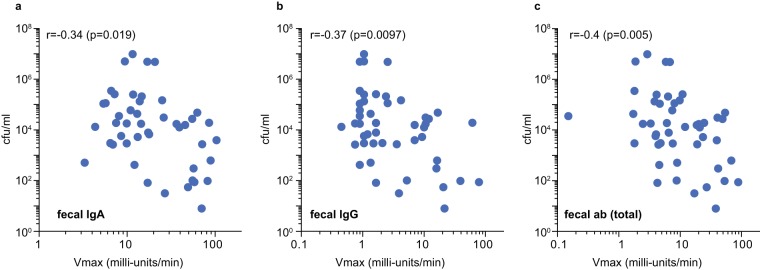
FIG 2.
Correlation of anti-EtpA fecal antibody levels and intestinal colonization in mice following oral vaccination. (a) Comparison of IgA anti-EtpA fecal antibody levels and colonization. (b) Fecal IgG versus colonization. (c) Total fecal antibody (ab) (IgG, IgM, and IgA) versus colonization. The results of Spearman (nonparametric) correlation coefficient (r) and corresponding P value are shown in the upper left-hand corner of each graph. Each point represents data from a total of 47 mice, including PBS controls (n = 12), dmLT adjuvant-only controls (n = 12), mice administered dmLT plus 200 μg EtpA (n = 11), and mice administered dmLT plus 400 μg EtpA (n = 12).

