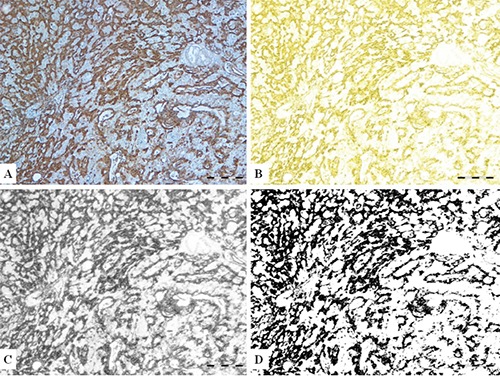
Figure 1.

Steps in image transformation, yielding bitmap image from original IHC vimentin stained section micrograph. A) IHC vimentin stained section micrograph (for this illustration one well differentiated carcinoma is depicted). B) CMYK mode of image. C) Greyscale image. D) Final bitmap image suitable for fractal analysis. Scale bars: 200 μm.
