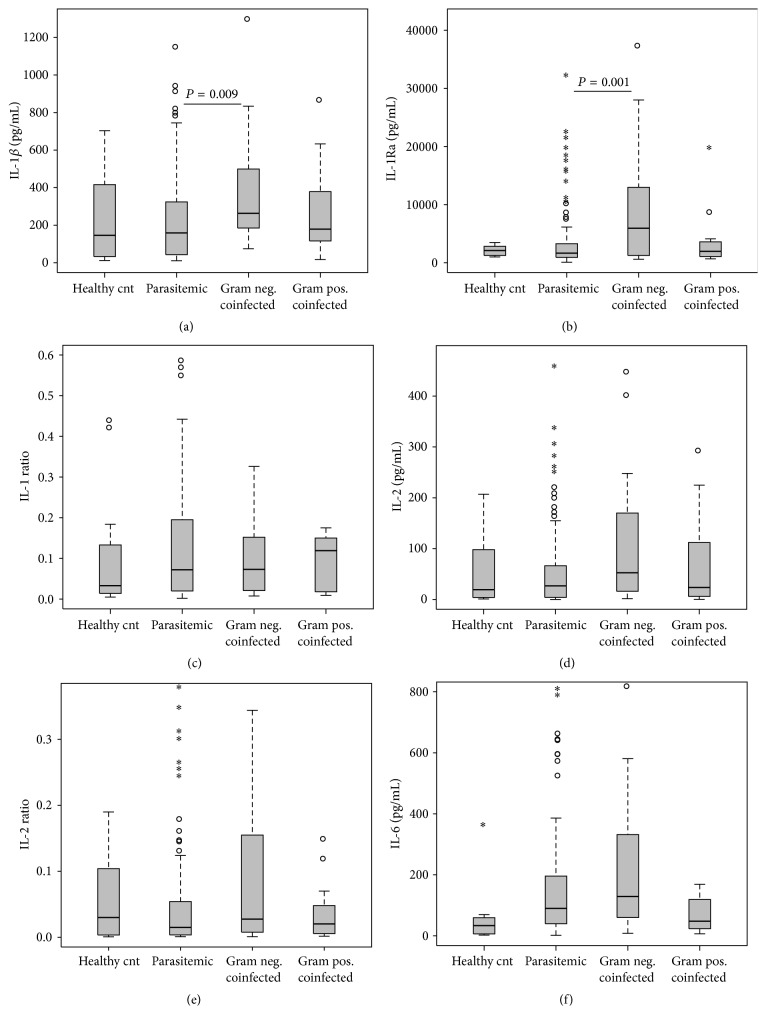
Figure 2.
Proinflammatory mediator profiles. Data are presented as box plots with whiskers and outliers. The box represents the interquartile range, while the whiskers represent the 10th and 90th percentiles. The line across the box indicates the median value, open circles (°) represent extremes, and asterisks (∗) depict outliers. Pair-wise comparisons between groups were conducted with Mann-Whitney U test. All units are in pg/mL. (a) IL-1β (Kruskal-Wallis [K-W], test P = 0.027). (b) IL-1Ra (K-W test, P = 0.005). (c) IL-1 Ratio (K-W, test P = 0.854). (d) IL-2 (K-W test, P = 0.068). (e) IL-2 Ratio (K-W test, P = 0.575). (f) IL-6 (K-W test, P = 0.115).

