Figure 2.

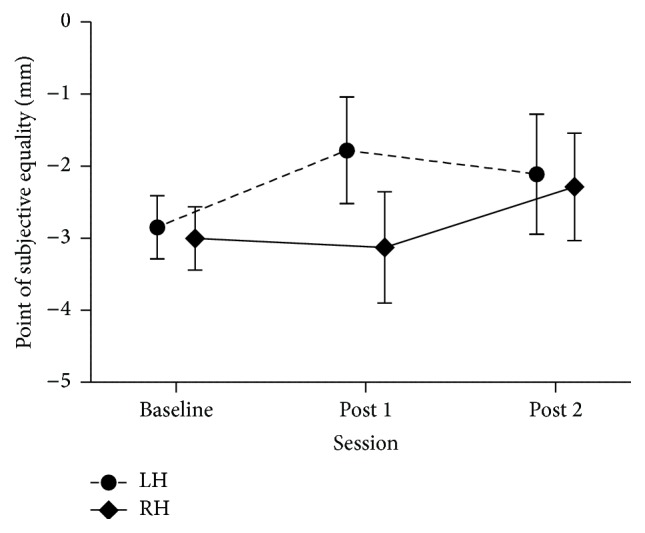
Average point of subjective equality (PSE) measured at baseline, post 1, and post 2 for each stimulated hemisphere group. PSE (y-axis) is represented in millimeters and error bars represent standard error of the mean (SEM).

Average point of subjective equality (PSE) measured at baseline, post 1, and post 2 for each stimulated hemisphere group. PSE (y-axis) is represented in millimeters and error bars represent standard error of the mean (SEM).