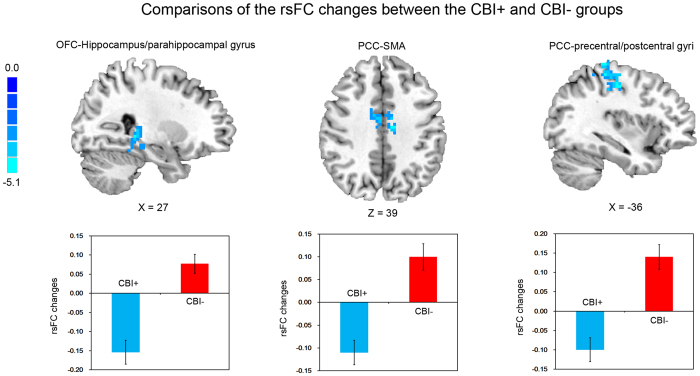
Figure 2. Comparisons of the rsFC changes ([rsFC at the second scanning]–[rsFC at baseline]) between the CBI + and CBI– groups.
rsFC, resting-state functional connectivity; CBI + , participants who received craving behavioral intervention; CBI–, participants who did not receive craving behavioral intervention; OFC, orbital frontal cortex; PCC, posterior cingulate cortex; SMA, supplementary motor area.

