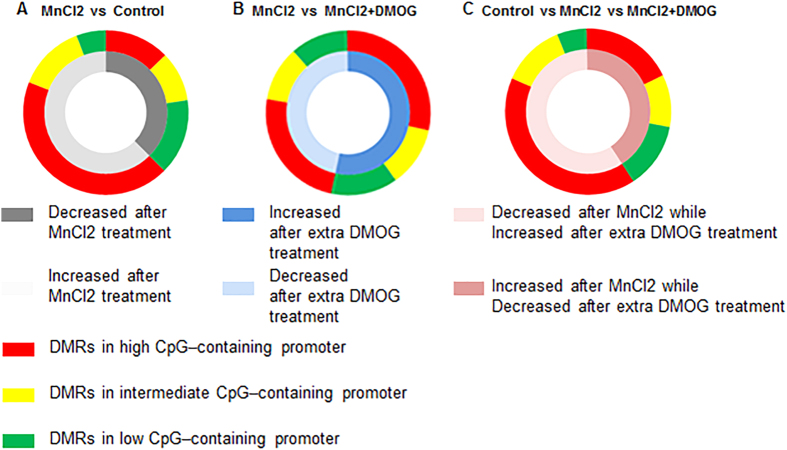
Figure 4. Differentially methylated regions (DMRs) classified into various genetic features, including high, intermediate and low CpG–containing promoters, are analysed between or among the different treatment groups.
(A) MnCl2 group vs. Control group; (B) MnCl2 group vs MnCl2 + DMOG group; (C) Control group vs. MnCl2 group vs. MnCl2 + DMOG group. In triple-group comparisons (C), only DMRs with restored methylation after combined DMOG treatment are analysed.

