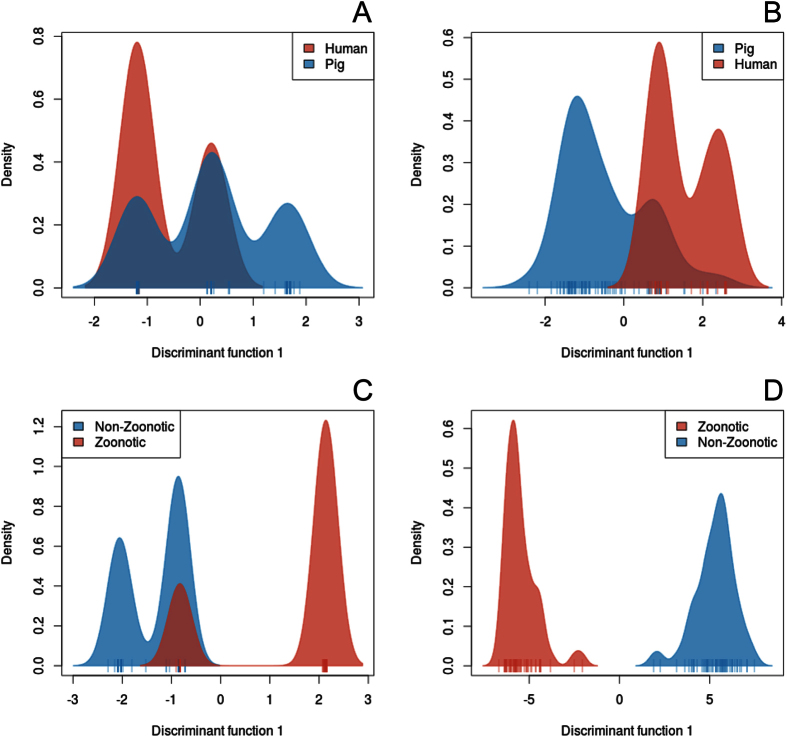
Figure 4. Discriminant analysis of principle components on the core and accessory genome, which illustrates the gene content differences in the accessory genome and SNP differences in the core genome.
DAPC plots were performed on the core genome (A,C) and on the accessory genome (B,D). The analyses were performed using two types of prior grouping: Host (A,B) and zoonotic potential (C,D). Density plots are displayed as only one linear discriminant is available when comparing between two groups.

