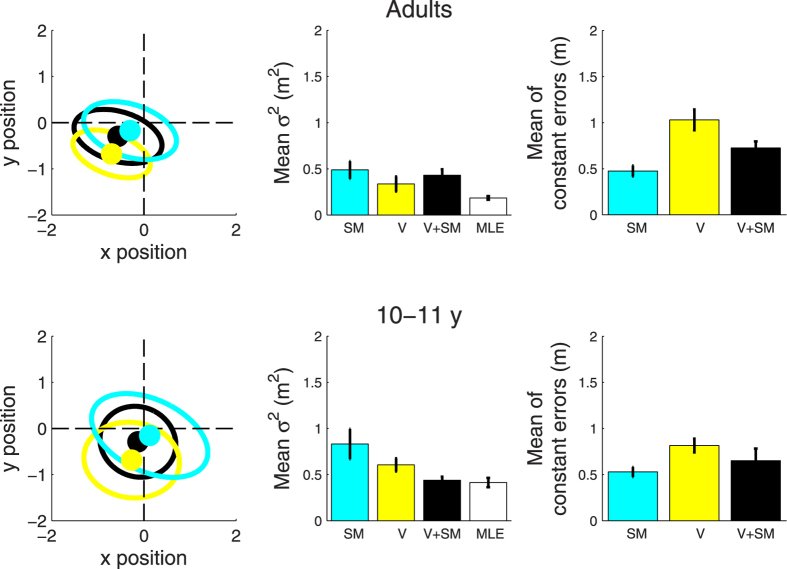
Figure 2. Average variable and constant error for child and adult participants.
Average results for the child and adult participants performing the self-motion (SM and cyan), visual (V and yellow) and visual + self-motion condition (V + SM and black). The panels on the left represent the bivariate fitting (ellipses) and its centre (constant error of the mean), the panels in the centre represent the mean variable error (area of the ellipses), while the panels on the right represent the mean of constant errors (which is similar, but not equal to the constant error of the mean). Children’s results are shown in the bottom panels, while adults’ data are presented in the top panels. The bar labelled MLE (in white) in the central panels refers to the reduction in variability predicted by the maximum likelihood estimation model for the visual + self-motion condition. The predicted estimate (σV+SM) was calculated individually for each subject, and then averaged, by entering the individual visual (σV) and self-motion (σSM) measure of total variable error into the equation  . Error bars represent the standard error of the mean.

