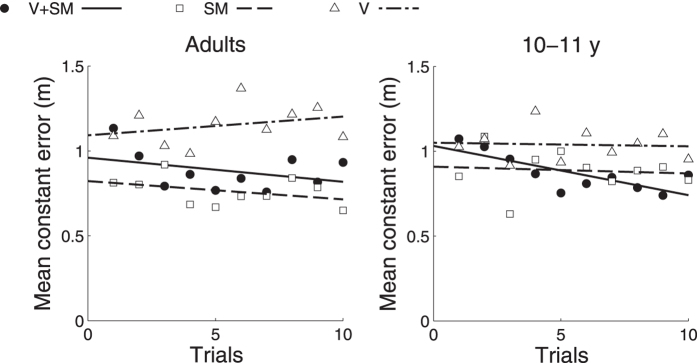
Figure 4. Relation between average constant error and number of trials for child and adult participants.
Relation between the average constant error in visual-self-motion (V + SM), visual (V) and self-motion condition (SM) and the number of trials is presented separately for the adult (left panel) and child group (right panel).

