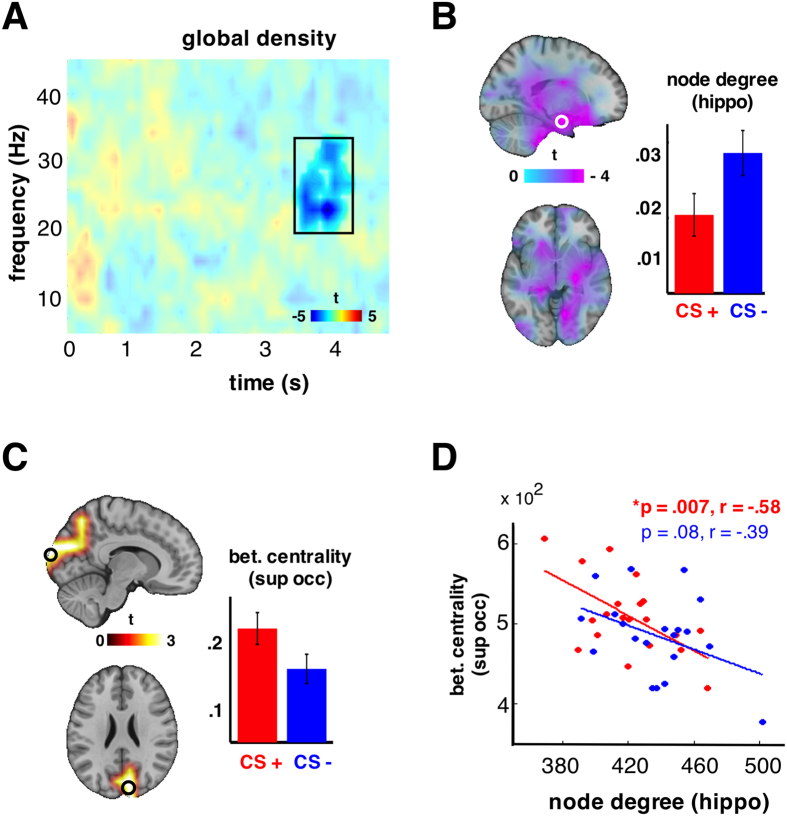
Figure 3.
(A) the statistics (CS+ vs. CS−) on connection density are illustrated. A significant negative cluster (p = 0.013, corrected), indicating lower density during CS+ than CS−, was observed lasting from 3.1 till 4 sec and on the frequency range 18–28 Hz. The results in (B–D) refer to this time-frequency window of interest. (B) There was a significant reduction (p = 0.004, corrected) in the node degrees of subcortical structures bilaterally. The barplot depicts the node degree of left hippocampal gyrus (relative to the baseline) where the effect was maximized. Error bars correct for between-subject variability. (C) There was a significant increase (p = 0.013, corrected) on the betweenness centrality on occipital regions also bilaterally. The barplot depicts the betweenness centrality of left superior frontal gyrus (relative to the baseline) where the effect was maximized. Error bars correct for between-subject variability. (D) The effects described at (B,C) show a significant correlation only for CS+ (red dots, star indicates significant correlation). The less connections at hippocampal gyrus, the more shortest paths passing through occipital cortex.

