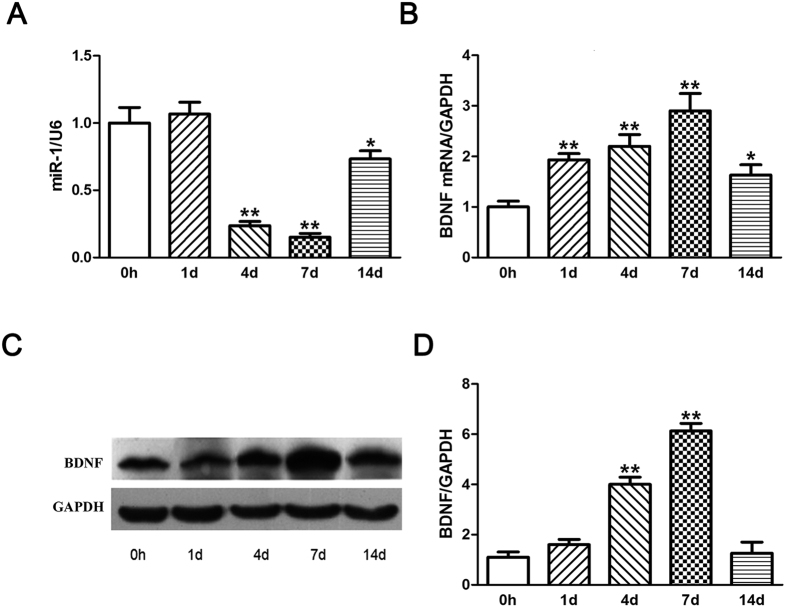
Figure 3. The temporal expression profile of miR-1 following sciatic nerve crush was negatively correlated with that of BDNF.
(A) The expressions of miR-1 in the crushed sciatic nerve segments were analyzed by qRT-PCR. U6 was used as an internal control. (B) The mRNA expressions of BDNF in the crushed sciatic nerve were analyzed by qPCR. GAPDH was used as an internal control. (C) The protein expressions of BDNF in the crushed sciatic nerve were analyzed by Western blots. GAPDH was used as an internal control. (D) Histogram showing relative quantitative comparisons of BDNF protein expressions at different time points following sciatic nerve injury. **p < 0.01, *p < 0.05.

