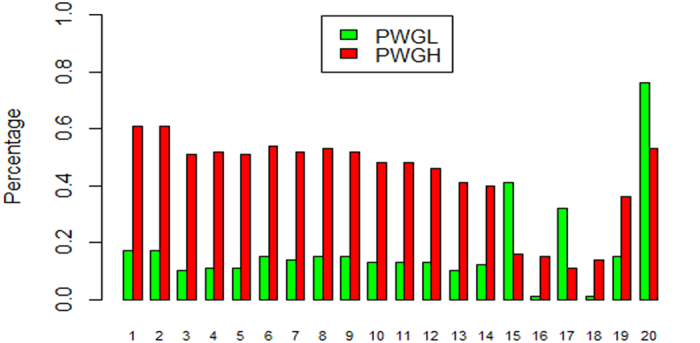
Figure 4. Effects of false positive CNVs on association study for PWG.

Y-axis: Percentage of individuals with loss type; X-axis: Significantly associated CNV segments (p < 0.01). The first 14 CNV segments were located in false positive CNVRs.

Y-axis: Percentage of individuals with loss type; X-axis: Significantly associated CNV segments (p < 0.01). The first 14 CNV segments were located in false positive CNVRs.