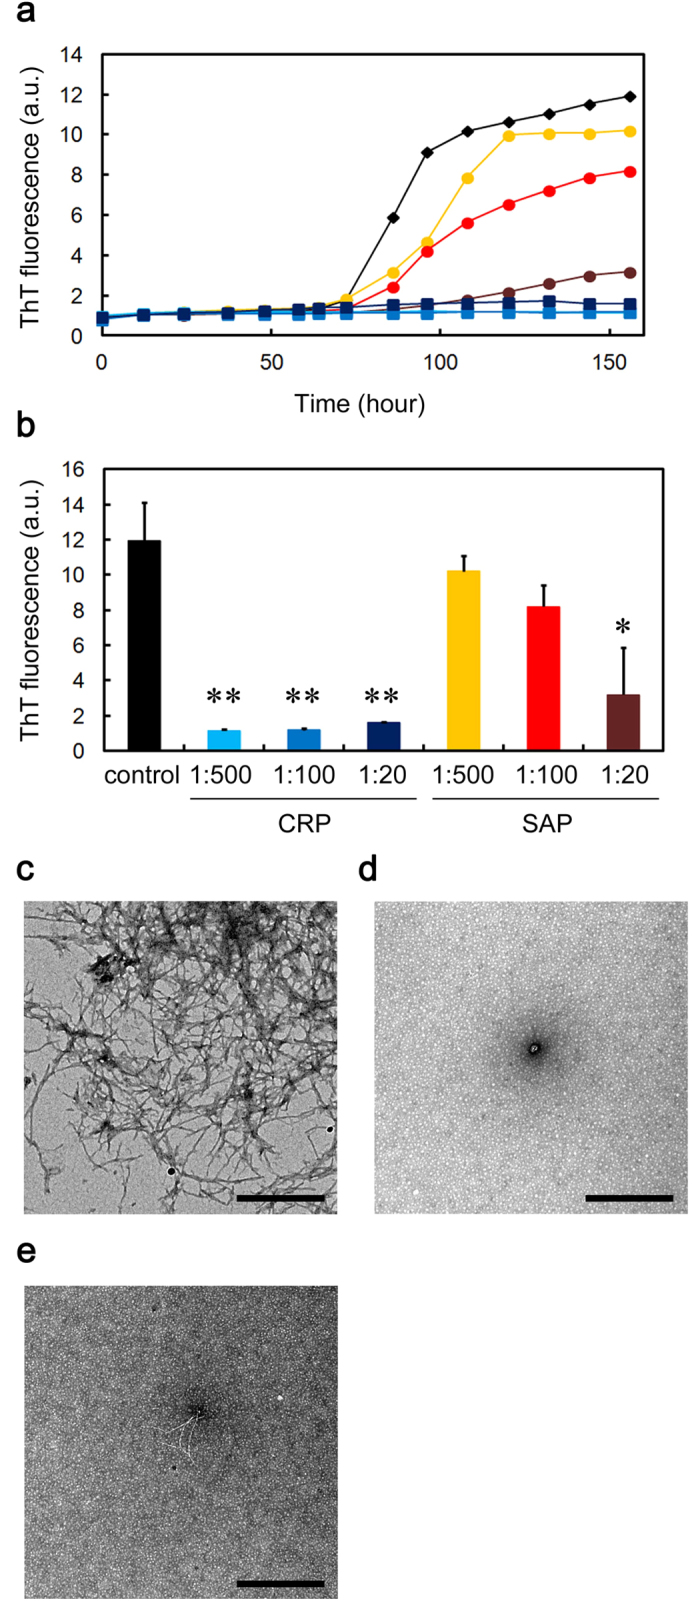
Figure 2. Effects of CRP and SAP on Aβ(1-40) amyloid fibril formation in Ca2+-free Tris-EDTA buffer.

(a) Time course of fibril formation monitored by ThT fluorescence in the absence (black diamond) or presence of 1:500 (molar ratio of CRP to Aβ(1-40)) (light blue square), 1:100 (blue square), or 1:20 (dark blue square) CRP, or 1:500 (orange circle), 1:100 (red circle), or 1:20 (dark brown circle) SAP. Each point represents the average of three independent incubations. Representative data of three independent experiments are shown. (b) ThT fluorescence of each sample at 156 h in (a). The data are mean ± SD of three independent incubations. Statistical analysis was performed by unpaired Student’s t-test. *P < 0.05, **P < 0.01 vs. control. (c–e) Electron microscopy images of the samples of fibril formation. The sample prepared in the absence (c) or presence of 1:20 CRP (d) or SAP (e) was incubated at 37 °C for 120 h. The scale bar represents 0.5 μm.
