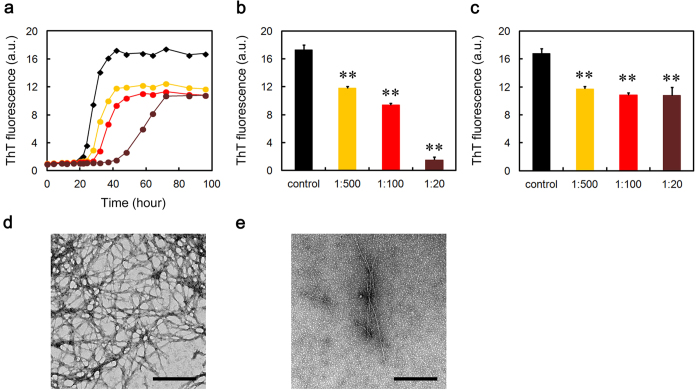
Figure 4. Effect of SAP on Aβ(1-40) amyloid fibril formation in MES-Ca buffer.
(a) Time course of fibril formation monitored by ThT fluorescence in the absence (black diamond) or presence of 1:500 (molar ratio of SAP to Aβ(1-40)) (orange circle), 1:100 (red circle), or 1:20 (dark brown circle) SAP. Each point represents the average of three independent incubations. Representative data of three independent experiments are shown. (b,c) ThT fluorescence of each sample at 42 (b) or 96 h (c) in (a). The data are mean ± SD of three independent incubations. Statistical analysis was performed by unpaired Student’s t-test. **P < 0.01 vs. control. (d,e) Electron microscopy images of the samples of fibril formation. The sample prepared in the absence (d) or presence of 1:20 SAP (e) was incubated at 37 °C for 48 h. The scale bar represents 0.5 μm.

