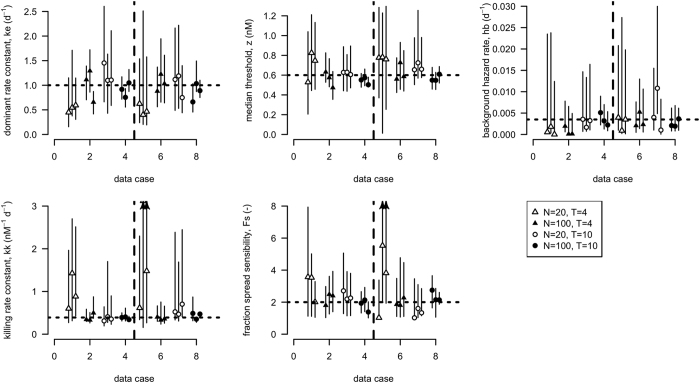
Figure 1. Parameter estimates; best-fit values with 95% credible intervals, resulting from the fits on the synthetic data.
Dotted horizontal line indicates the true parameter value that was used to produce the synthetic data sets. Data cases have bioassay designs which differ in number of animals (N), number of days test duration (T). Vertical broken line separates the datasets with 8 exposure concentrations (left) from those with only 5 (right) exposure concentrations. Arrows on confidence intervals indicate that the error bar extends much further (truncated to improve readability).

