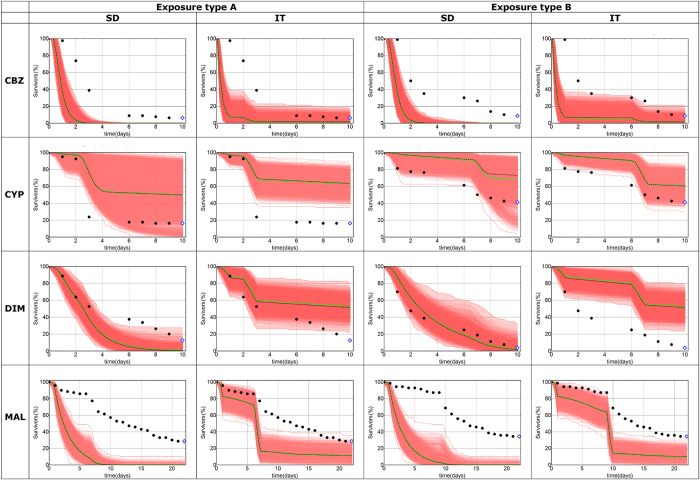
Figure 2. Forecasted and observed survival.
The shaded areas indicate the confidence regions (95% parametric uncertainty, 100% stochasticity, 10000 simulations), while the solid green line is the median of these predictions. The more intense the red, the more predictions are overlapping. The observed survival is shown with black dots, but the last data points are highlighted with blue diamonds because those are also shown in Fig. 3.

