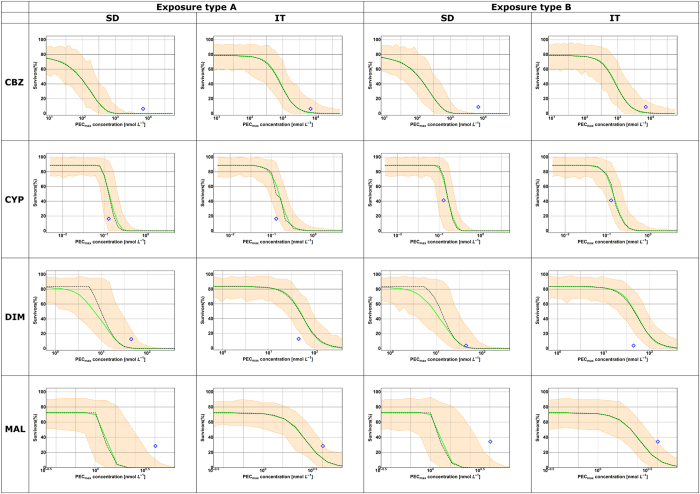
Figure 3. Forecasted dose response curves at the last day of the repeated pulsed exposure experiments.
The shaded areas indicate the confidence regions (95% parametric uncertainty, 100% stochasticity, 10000 simulations), while the solid green line is the median of these predictions and the observed survival is shown as blue diamond.

