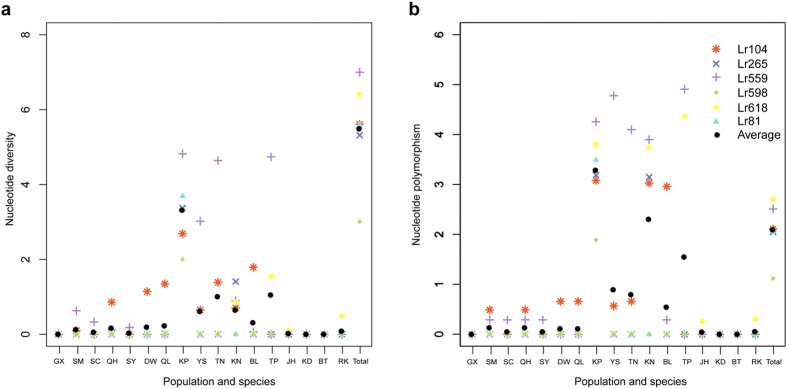
Figure 1. Statistics of genetic variation based on Sanger sequencing data.
(a) Nucleotide diversity π and (b) Nucleotide polymorphism θ at six nuclear genes in 17 populations of Lumnitzera racemosa from the Indo-West Pacific region. Each symbol represents one of the six genes and the average value of six genes from each population. Population abbreviations are defined in Table 1.

