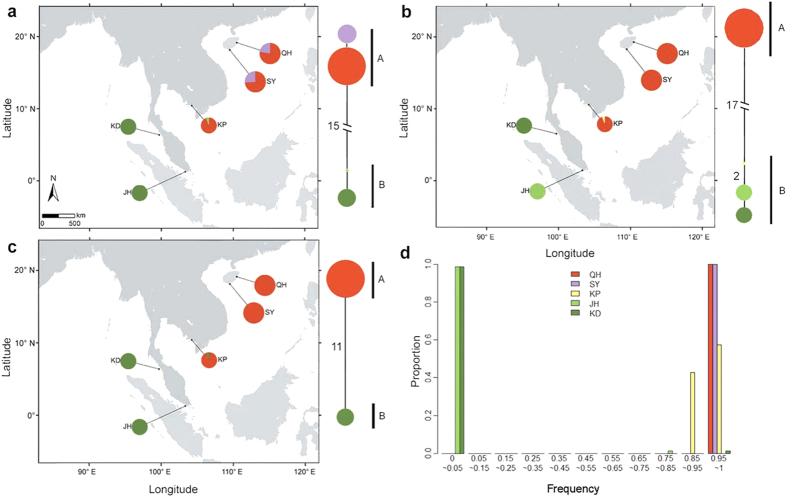
Figure 2. Haplotype information of Lumnitzera racemosa in the five populations based on Illumina sequencing data.
(a–c) Show the haplotype networks and distributions of three polymorphic gene segments (Lr191, Lr546b and Lr667a). The haplotype distributions were created by GenGIS version 2.4.047 and MapMaker version 1.0 (http://kiwi.cs.dal.ca/GenGIS/MapMaker)48. Each colour represents a single haplotype. The circle sizes in the geographic distributions and the haplotype networks are proportional to the sample size of each population and the frequency of each haplotype, respectively. Each branch with more than one mutational step is labelled. Capital letters A and B beside the haplotype networks represent group A and B, respectively. (d) The frequency histogram of group A in 75 highly divergent gene segments from the five populations. Group A is defined based on the criteria described in the Materials and Methods section. Population abbreviations are defined in Table 1.

