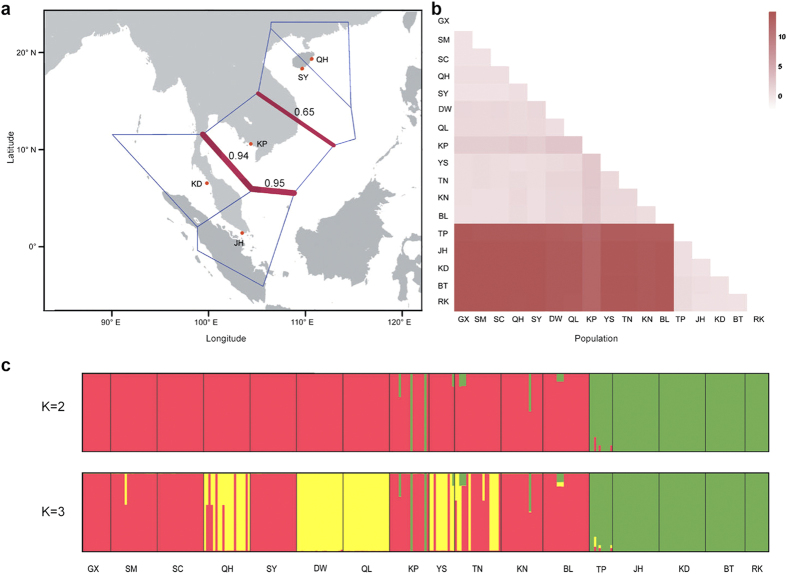
Figure 4. Genetic differentiation and population structure across populations of Lumnitzera racemosa in the Indo-West Pacific region.
(a) Results of the BARRIER analysis based on 85 FST matrices obtained from Illumina sequencing data. The digital map of this area was created by MapMaker version 1.0 (http://kiwi.cs.dal.ca/GenGIS/MapMaker)48. The blue line represents a Voronoï tessellation. The red line represents detected barriers and the thickness corresponds to the strength. The number label beside the red line indicates the percentage of genes that support this barrier. (b) A heatmap of the averages of pairwise Kxy values of six nuclear genes among 17 populations. The colour depth is proportional to the level of genetic differentiation. (c) The results of the Bayesian clustering analysis for 295 Lumnitzera racemosa individuals based on six nuclear genes. Each bold bar separated by a black line represents one population and each colour represents one cluster. The best clustering number was estimated to be equal to 2 (K = 2).

