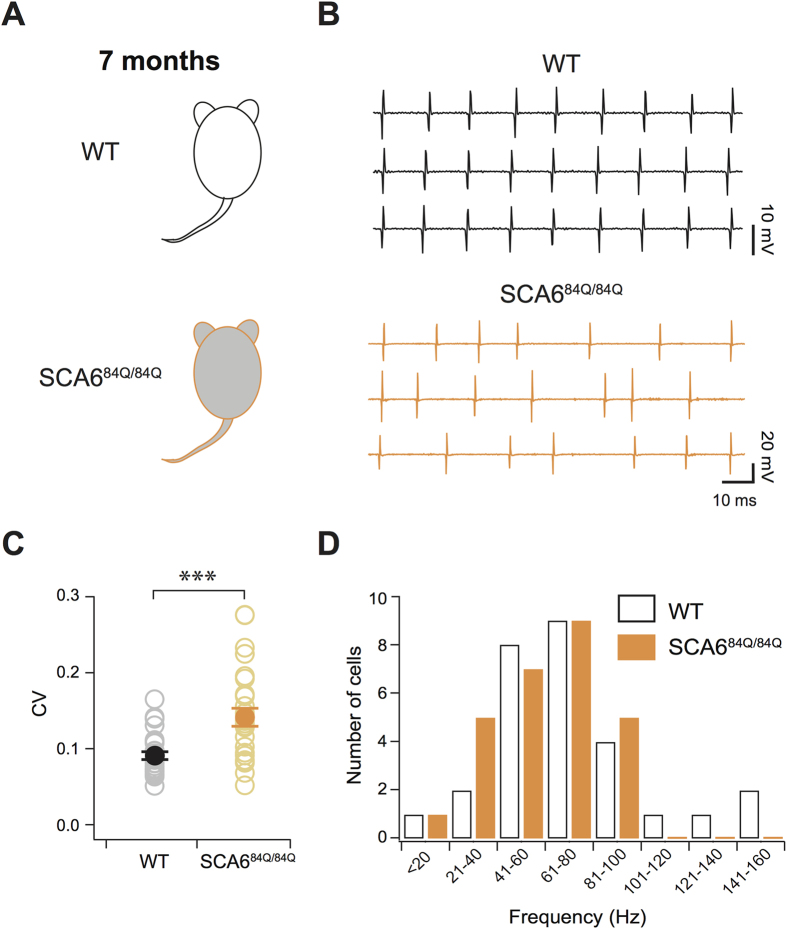
Figure 2. Firing precision and rate deficits in homozygous SCA684Q/84Q mice.
(A) 7-month-old homozygous WT and SCA684Q/84Q mice. (B) Sample traces show action potentials from a single Purkinje cell from a WT (black, top) and an SCA684Q/84Q (orange, bottom) mouse at 7 months. (C) Changes in firing precision demonstrated by an elevated CV of inter-spike intervals for Purkinje cell action potential firing in SCA684Q/84Q mice (WT: CV = 0.09 ± 0.005; SCA684Q/84Q: CV = 0.14 ± 0.01; P < 0.0001). (D) Histogram showing firing rates of individual Purkinje cells from SCA684Q/84Q mice (orange) and WT Purkinje cells (black); note the absence of Purkinje cells firing at frequencies >100 Hz in SCA684Q/84Q mice. Average WT Purkinje cell firing rate = 71.7 ± 6.1 Hz; average SCA684Q/84Q Purkinje cell firing rate = 56.4 ± 3.9 Hz; P = 0.041; N = 28 for WT, N = 26 for SCA684Q/84Q for (C,D). Comparisons made with Student’s t tests; ***P < 0.005.

