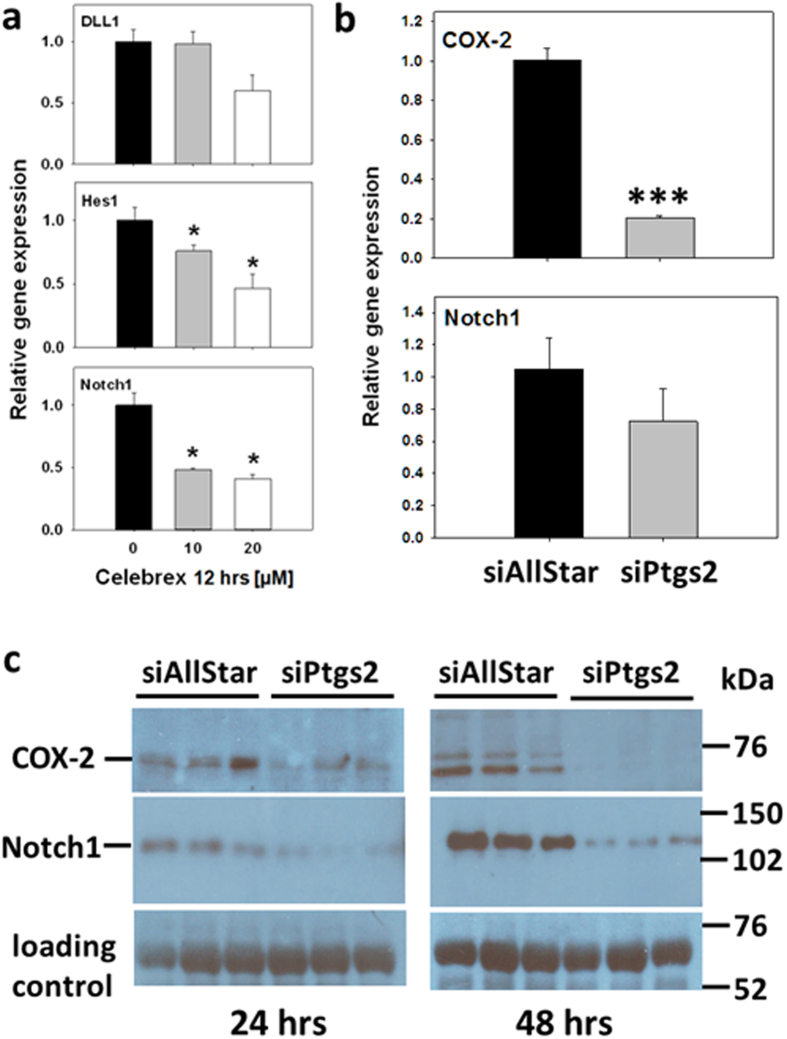
Figure 4. COX-2-dependent modulation of Notch1 expression.
(a) Relative gene expression levels of DLL1, Hes1 and Notch1 in Capan-1 cells as measured by qRT-PCR. Capan1 were treated 24 hours after seeding with ethanol as control (0) or with 10 or 20 μM celebrex for 12 hours. Amplification of COX-1 was performed for normalization. Data is presented as mean ± SEM of n = 3 cultures, each with 2 technical replicates each. Student’s t-test was performed to analyze for statistical significance (*p < 0.05). (b) Notch1 mRNA expression in BxPC3 cells after siRNA-mediated Ptgs2 (COX-2) knockdown. BxPC3 cells were transfected with 5 nM of siPtgs2 or 25 nM siAllStar negative control. Plates were incubated, and Ptgs2 was monitored along with Notch1 expression at 24 hours by qRT-PCR. Data is presented as mean ± SEM of n = 3 cultures, each with 2 technical replicates each. (Student’s t-test: ***p < 0,001). (c) Reduced Notch1 protein levels in BxPC3 cells after siRNA-mediated Ptgs2 (COX-2) knockdown. BxPC3 cells were transfected with 5 nM of siPtgs2 or 25 nM siAllStar negative control and incubated for 24 or 48 hours. COX-2 protein was monitored along with Notch1 protein by immunoblot analysis. Data is presented as mean ± SEM of n = 3 cultures, each. Semiquantitative evaluation revealed 1 ± 0.227 arbitrary units for COX-2 in siAllStar negative control and 0.228 ± 0.018 in siPtgs2 group indicating an about 4-fold knockdown of COX-2 protein at 48 hours. This effect was only 1.4-fold at 24 hours as calculated from siAllStar negative control (1 ± 0.149) versus siPtgs2 (0.725 ± 0.211) samples.

