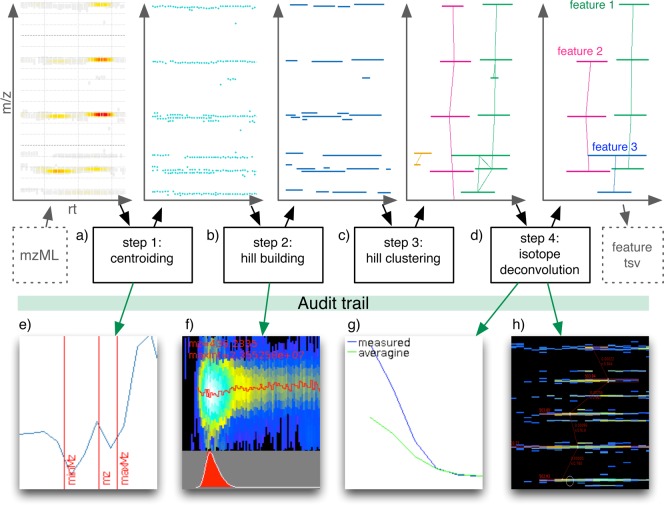
Figure 1.
Overview of the Dinosaur feature-finding algorithm. Features are detected by (a) centroiding MS1 spectra; (b) assembling centroid peaks into single isotope traces, also referred to as hills; (c) clustering of hills by theoretically possible m/z differences; and (d) deconvolution of clusters into charge-state-consistent features. The plot trail plots randomly selected parts of the intermediary data to support the tuning of parameters and increase transparency of the computational steps. Created plot types are (e) a line graph of a peak centroid, (f) a heatmap and histogram of hill construction, (g) an isotopic profile compared to an averagine, and (h) a complete heatmap of a data section with annotated detected features.

