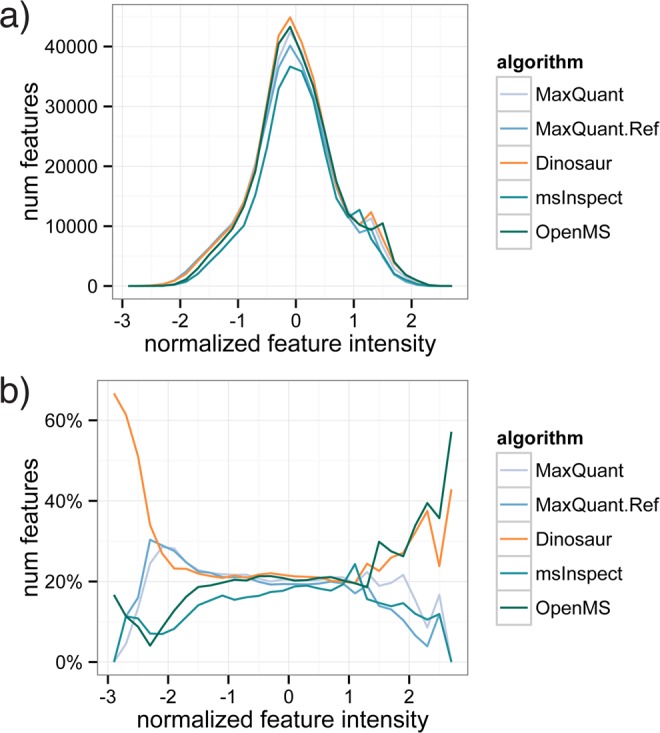
Figure 3.

Intensity distribution of ID-matched features for compared feature-detection tools. Feature intensities from each tool were normalized by the division by the median intensity of features linked to IDs that all tools matched. (a) Absolute distribution of features over the normalized intensity range. (b) The relative number of features in each intensity bin. MaxQuant tools are relatively strong at low-intensity features, and the OpenMS tool is relatively strong at high-intensity features. Dinosaur shares both these strengths.
