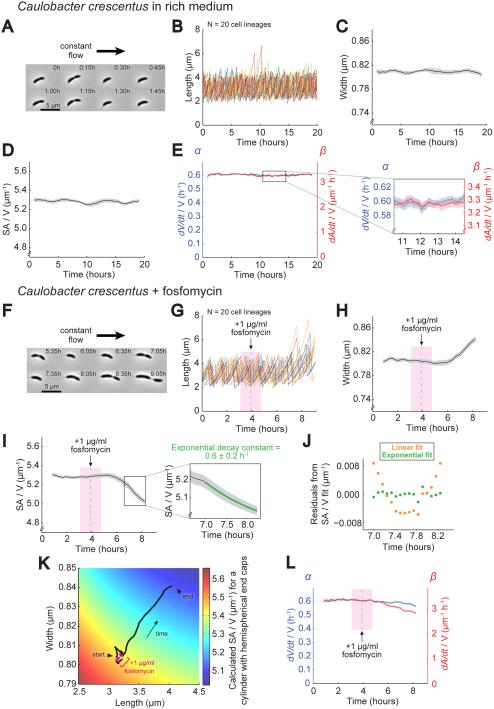
Figure 3. Inhibition of PG Biosynthesis Slows Down SA Growth Relative to Volume Growth, Leading to a Drop in SA/V.
A. Representative images of a C. crescentus lineage grown under a constant flow of fresh rich medium (PYE) where the adherent mother cell was retained on the coverslip while daughter cells were swept away after division. See also Movie S1.
B. Plot of cell length for 20 lineages grown as in (A). Images were taken every 5 m. Each color represents a different lineage.
C. Average cell width for lineages from (B) over time bounded by SEM.
D. Average SA/V for lineages from (B) plotted as in (C).
E. Average α and β for lineages from (B) plotted as in (C). Inset shows the magnitude of fluctuations in α and β.
F. Representative images of a C. crescentus lineage grown using the same perfusion setup as in (A). Cells were grown initially in rich medium and then switched to rich medium plus 1 μg/ml fosfomycin. Images shown were taken starting ~1.5 h after addition of drug. See also Movie S2.
G. Plot of cell length for 20 lineages grown as in (F). The gray dashed line marks the addition of fosfomycin, and the bounding pink box denotes the size of the sliding average window. Images were taken every 5 m. Each color represents a different lineage.
H. Average cell width for lineages from (G) plotted as in (C).
I. Average SA/V for lineages from (G) plotted as in (C). The inset shows the region where the SA/V traces were fit with a decaying exponential. See also Figure S1.
J. Residuals from fitting the average SA/V values from the region shown in the inset of (I) with both a linear and an exponential function.
K. Calculated SA/V (color scale) superimposed with the trajectory of average width and length for lineages treated with fosfomycin (same data as (G-H)). The white point marks when drug was first added, and the bounding pink region represents the sliding average window.
L. Average α and β for lineages from (G) calculated as in (E), plotted as in (C).

