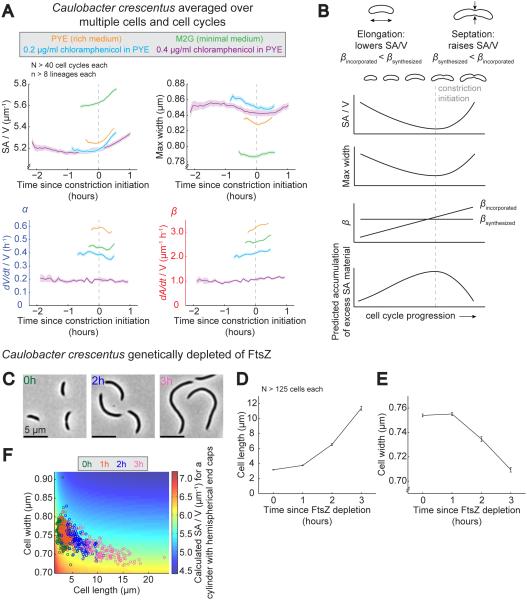
Figure 6. Excess Surface Material May Accumulate During Cell Elongation.
A. Cell cycle-dependent averages of SA/V, maximum width, α, and β for C. crescentus cells grown in a variety of steady-state conditions. Single-cell lineages from perfusion experiments were subdivided into individual cell cycles, aligned, averaged, and centered about constriction initiation. Shown is the average for each condition over time bounded by the SEM. N>40 cell cycles each. See also Figure S3.
B. Diagram summarizing cell cycle-dependent changes in SA/V, maximum width, and βincorporated, and our prediction for the accumulation of excess SA material given a constant underlying rate of SA material production per unit volume, βsynthesized.
C. Representative images of C. crescentus cells genetically depleted of FtsZ for the amount of time indicated.
D. Average length of C. crescentus cells genetically depleted of FtsZ for 0-3 h. N>125 cells for each condition. Error bars = SEM.
E. Average width of C. crescentus cells genetically depleted of FtsZ. Same cells as (D). Error bars = SEM.
F. Calculated SA/V (color scale) with length and width values for individual cells from populations genetically depleted of FtsZ. Each circle represents an individual cell, and colors correspond to different times since FtsZ depletion. Same cells as (D-E). See also Figure S4.

